---
title: Tag reporting
description: The tag reporting view shows usage and performance data for the tags implemented on your site.
url: https://docs.tealium.com/iq-tag-management/tags/tag-reporting/
---
This view helps you interpret various performance metrics, such as site visits, Tealium-hosted server requests, and vendor tag loads. Tag reports are intended for basic IT purposes and should not be considered an analytics tool.
Tag reports can take up to 48 hours to fully process and display the data flowing through the Tealium platform. If your date range only includes the last 24-48 hours, you might not see data in the reports. As a best practice, enter an end date that is at least 48 hours before the current date.
## View tag reports
Use the following steps to view the tag reporting charts:
1. In the left sidebar, click **Client-Side Tools > Tag Reporting**.
The tag **Usage** and **Operational** reports for the last seven days appear for all profiles.
1. Select a profile from the **Perspective** drop-down list.
The **Tag Usage and Operational** reports for the selected profile appear.
1. In the **Dates** fields, use the calendar drop-down top select a date range.
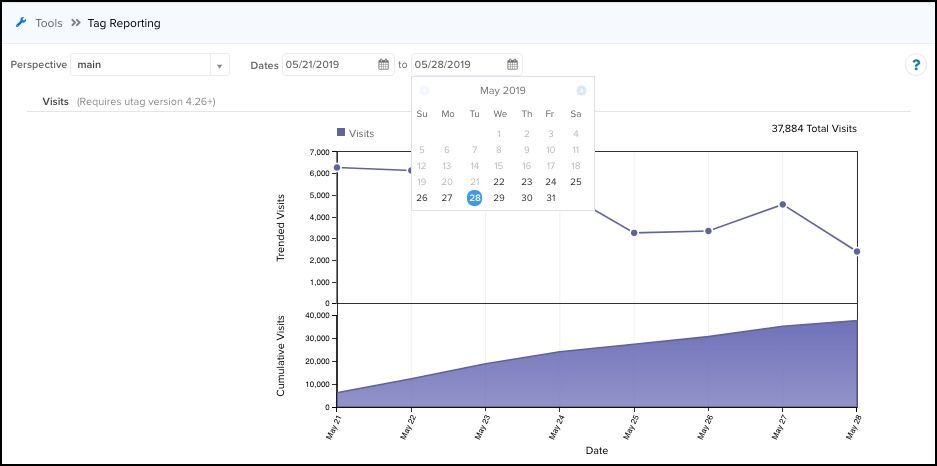
The reports for the selected timeframe appear.
## About tag reports
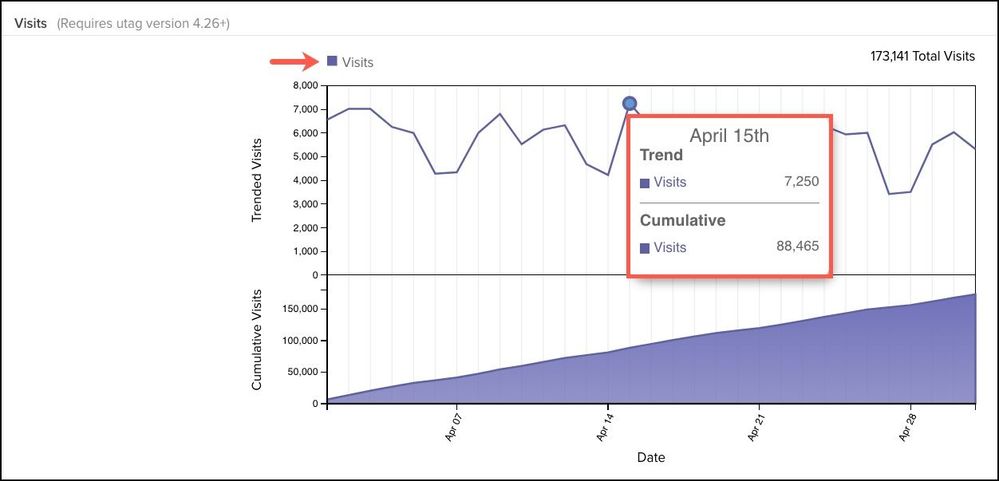
Each chart in the tag report features two different views: **Trended** and **Cumulative**.
* **Trended**
This view displays how the data trends or varies over the date range selected.
* **Cumulative**
This view displays the total of all data points captured up until that date selected in the ending date range, as shown in the following example:
The following sections describe the information conveyed in each report type.
### Visits report
The **Visit Report** displays the visit (session) count for the period of time specified.
You must have `utag.js` version 4.26 or later to view this report. For more information about updating the `utag.js` template, see our knowledge base article [Best Practices for Updating to the Latest Version of utag.js](https://support.tealiumiq.com/en/support/solutions/articles/36000363470).
A visit, or session, is the amount of time a visitor spends navigating through your site. The visit begins with the first page request and ends when the visitor navigates away from your site or when a predetermined period of time has elapsed (usually 30 minutes).
### Loader tag report
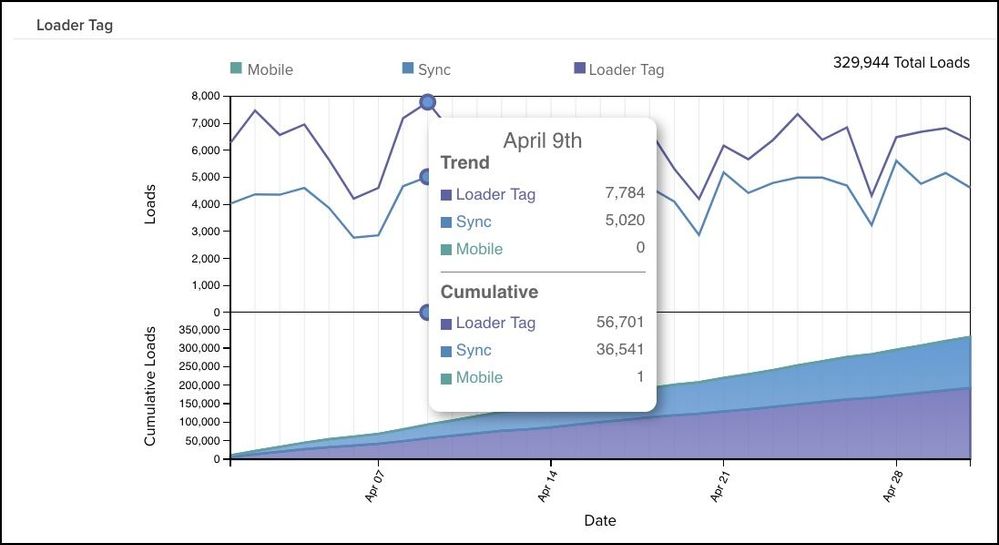
The **Loader Tag Report** displays the number of tag requests (loads) that occur during the period of time specified. Loads are plotted for the `utag.js`, `utag.sync.js`, and the `mobile.html `file requests.
### Vendor tags
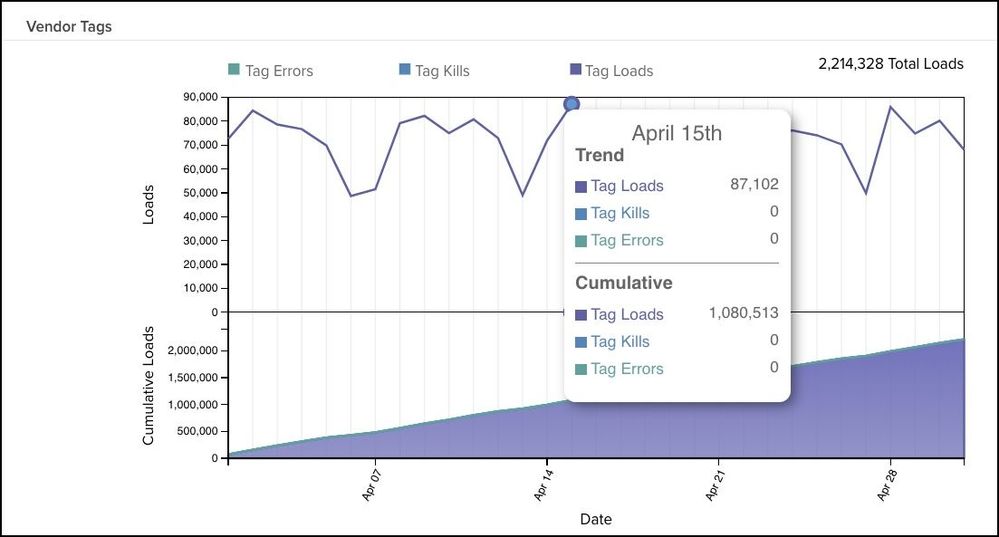
The **Vendor Tags Report** displays the number of times the vendor tags (`utag.\*.js`) were loaded on a given day in the specified date range.
**Tag Error** and **Tag Kills** data is not collected and always displays `0`.