---
title: Live events
description: The Live Events chart is used to inspect real-time incoming data. This article shows how to inspect and evaluate data quality.
url: https://docs.tealium.com/server-side/event-health/live-events/
---
## How it works
The live events chart displays events in real time coming from all data sources and all event feeds. Each bar in the chart has a height to indicate the volume of events detected. If you have active [event specifications](), the chart reflects the quality of the incoming data with green and red segments to represent valid and invalid events, respectively.
## Use live events
Access live events by going to **Validate > Live Events**.

You control which events are displayed in the chart using the **Data Sources** and **Event Feeds** lists. The default selections are **All Data Sources** and **All Events**. Adjusting these menus refreshes the chart and displays the event activity for the selected combination.

If you select a specific event for an event feed, the chart displays data for that event only. To compare an event feed to all event data, click **Compare against All Events**. For example, you can create event feeds for specific countries or regions, then compare a country or region event feed to all events.
## Use a trace ID
Use a trace ID to filter out all incoming events except for the ones you trigger. A trace ID is a temporary, unique identifier to be inserted into your event tracking code so that only specific events are displayed in the live events chart. This is commonly used for testing purposes.
To set up a trace:
1. Click **Trace ID**.
The trace options modal is displayed.
1. Click **Start Trace** and follow the instructions.
1. Copy the generated trace ID and click **Continue**.
1. Open a new Chrome browser window with the page to test.
1. Open **Tealium Tools > Trace** and enter the trace ID.
The live events chart now shows only events triggered during your traced session. You can start a new trace or rejoin an existing trace following the same steps.
## Filter by specification status
If you have [event specifications]() defined, Live Events displays the quality of your incoming data. Each bar in the chart is segmented according to the status of the event specifications applied. The following filters can be toggled on or off to adjust the display of the chart:

* **Valid Events**
These events satisfy the requirements of an active event specification. This means that the events have a known value for the `tealium_event` attribute and all the required attributes from the specification. The more valid events you see the better. This means your installations are sending the data expected in your specifications.
* **Invalid Events**
These events match an event specification, but do not have the required attributes. This means that the events have a known value for the `tealium_event` attribute, but they are either missing required attributes or the attributes contain unexpected values. These issues can be resolved by fixing the installation code that is sending the events or, in some cases, adjusting the event specification.
* **No Spec**
These events do not have a matching event specification. This means that the events either do not have the `tealium_event` attribute or the value does not have a corresponding event specification.
Event specifications do not filter out data. Even if an event is invalid, the system still processes the event.
## View event details
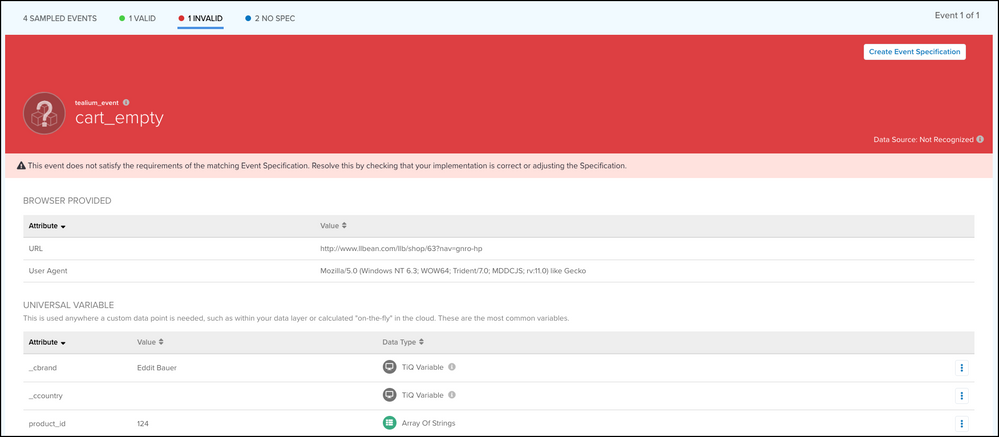
Click a bar in the chart to view the event details from an incoming data sample. The data sample is limited to 10 events per bar in the chart. Events are primarily identified by the `tealium_event` attribute. The detected value of this attribute is displayed in the heading of the event detail. If `tealium_event` has a corresponding event specification, the event is displayed as either valid or invalid according to the requirements in the specification. The heading also displays the data source from which the event originated.
For example, a valid `cart_empty` event:
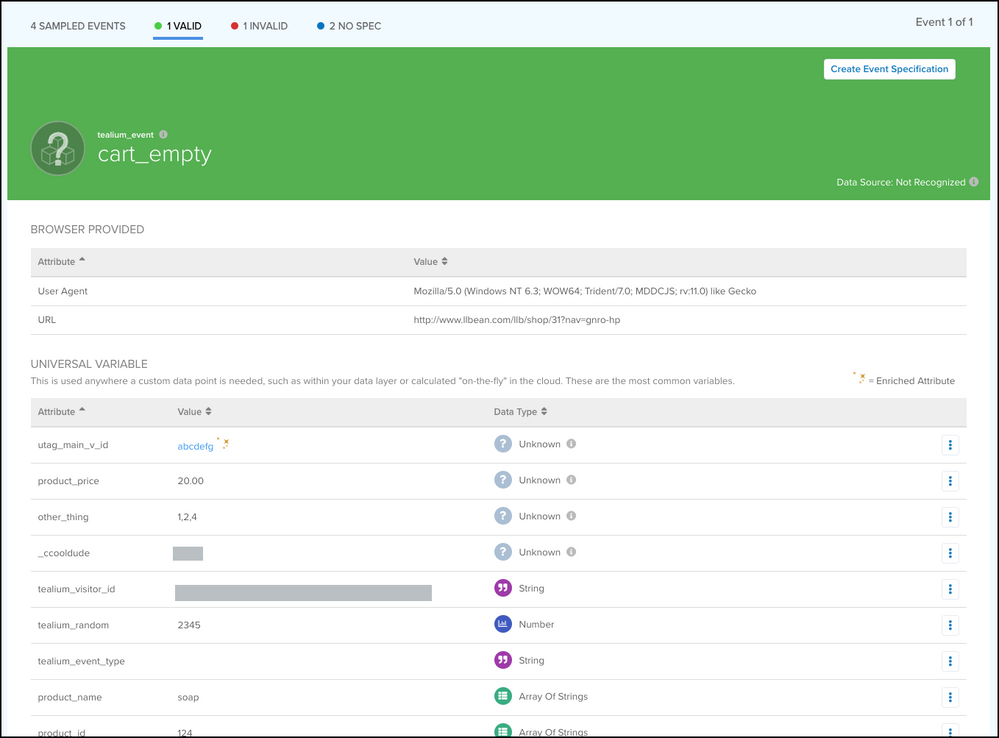
The event attribute details are organized into the following attribute types: Universal Variable, JavaScript Page Variable, HTML Metadata, First-party Cookie, Query String Parameter, and Tealium-provided.
An invalid `cart_empty` event due to lack of matching event specification resembles the following:
## Define unknown attributes
An unknown attribute is an attribute detected in the incoming event that has not yet been created in your account as an event attribute with a data type (for example: string, number, boolean, etc.) Before you can use an attribute in your account, it must be created as an event attribute.
In the event details view, unknown attributes are indicated in the **Data Type** column as `Unknown`.

Unknown attributes can be defined directly from this screen by using the **Quick Add** action, as follows:
1. Next to an unknown attribute, click the more options icon and then click **Quick Add**.
1. Select the data type.
1. Click **Define**.
The attribute now displays its new data type.
## Create an event specification
Events with a custom value for `tealium_event` are displayed as `Unknown` in the event details view if they do not have an associated event specification. When this occurs, create a custom event specification directly from the event details view based on the detected value of `tealium_event` and the attributes of the event.
We recommend that you define unknown attributes before you create an event specification from a live event. For more information, see [Define unknown attributes](#define-unknown-attributes).
For more information, see [Manage event specifications](https://docs.tealium.com/manage-event-specifications/#create-an event-specification).