This article provides information about the healthcare dashboard.
The healthcare dashboard provides prebuilt visuals for healthcare organizations using event-based data from EventDB. Use this dashboard for visitor and session insights across traffic sources, device types, new and returning traffic, and UTM parameters.
Requirements
The healthcare dashboard requires:
- EventDB
- The
utag_main__seattribute which tracks the number of sessions for a visitor. If you encounter errors when generating the dashboard, this attribute may need to be configured as a first-party cookie in EventStream and made available in EventDB.
Generate the dashboard
To generate the healthcare dashboard:
- Go to Analyze > Insights > Templates.
- Find the Healthcare dashboard template, and click View Details.
- Click Generate Dashboard.
After you generate the healthcare dashboard, it may take up to 2 hours for data to appear.
If you disable the healthcare dashboard feature on your profile, the dashboard and its data are deleted 30 days after you publish this change. To retain your data, re-enable the feature within this period.
Access the dashboard
After generation, access the dashboard in Analyze > Insights > Dashboards.
For more information about managing dashboards, see Manage dashboards.
If you have trouble accessing or using the dashboard, contact your Tealium Account Manager.
Dashboard controls
The healthcare dashboard includes the following controls:
- Date range: Filter data by a specific date range.
- Is returning visit: Filter by returning visits.
- Device: Filter by device type.
- Is bot: Filter to include or exclude bot traffic.
Prebuilt visuals
The healthcare dashboard includes the following prebuilt visuals:
General
Displays visitor and session counts over time, categorized by:
- Bot vs Real User
- Browser type
- Referrer URL
- Device
- New vs Returning Traffic
New vs Returning Traffic – UTM parameters
Displays visitor and session counts over time for new vs. returning traffic, grouped by the following UTM parameters:
- UTM Source
- UTM Medium
- UTM Campaign
- UTM Term
- UTM Content
Device Traffic – UTM Parameters
Displays visitor and session counts over time for various device types, grouped by the following UTM parameters:
- UTM Source
- UTM Medium
- UTM Campaign
- UTM Term
- UTM Content
The following figure shows an example of the healthcare dashboard visuals.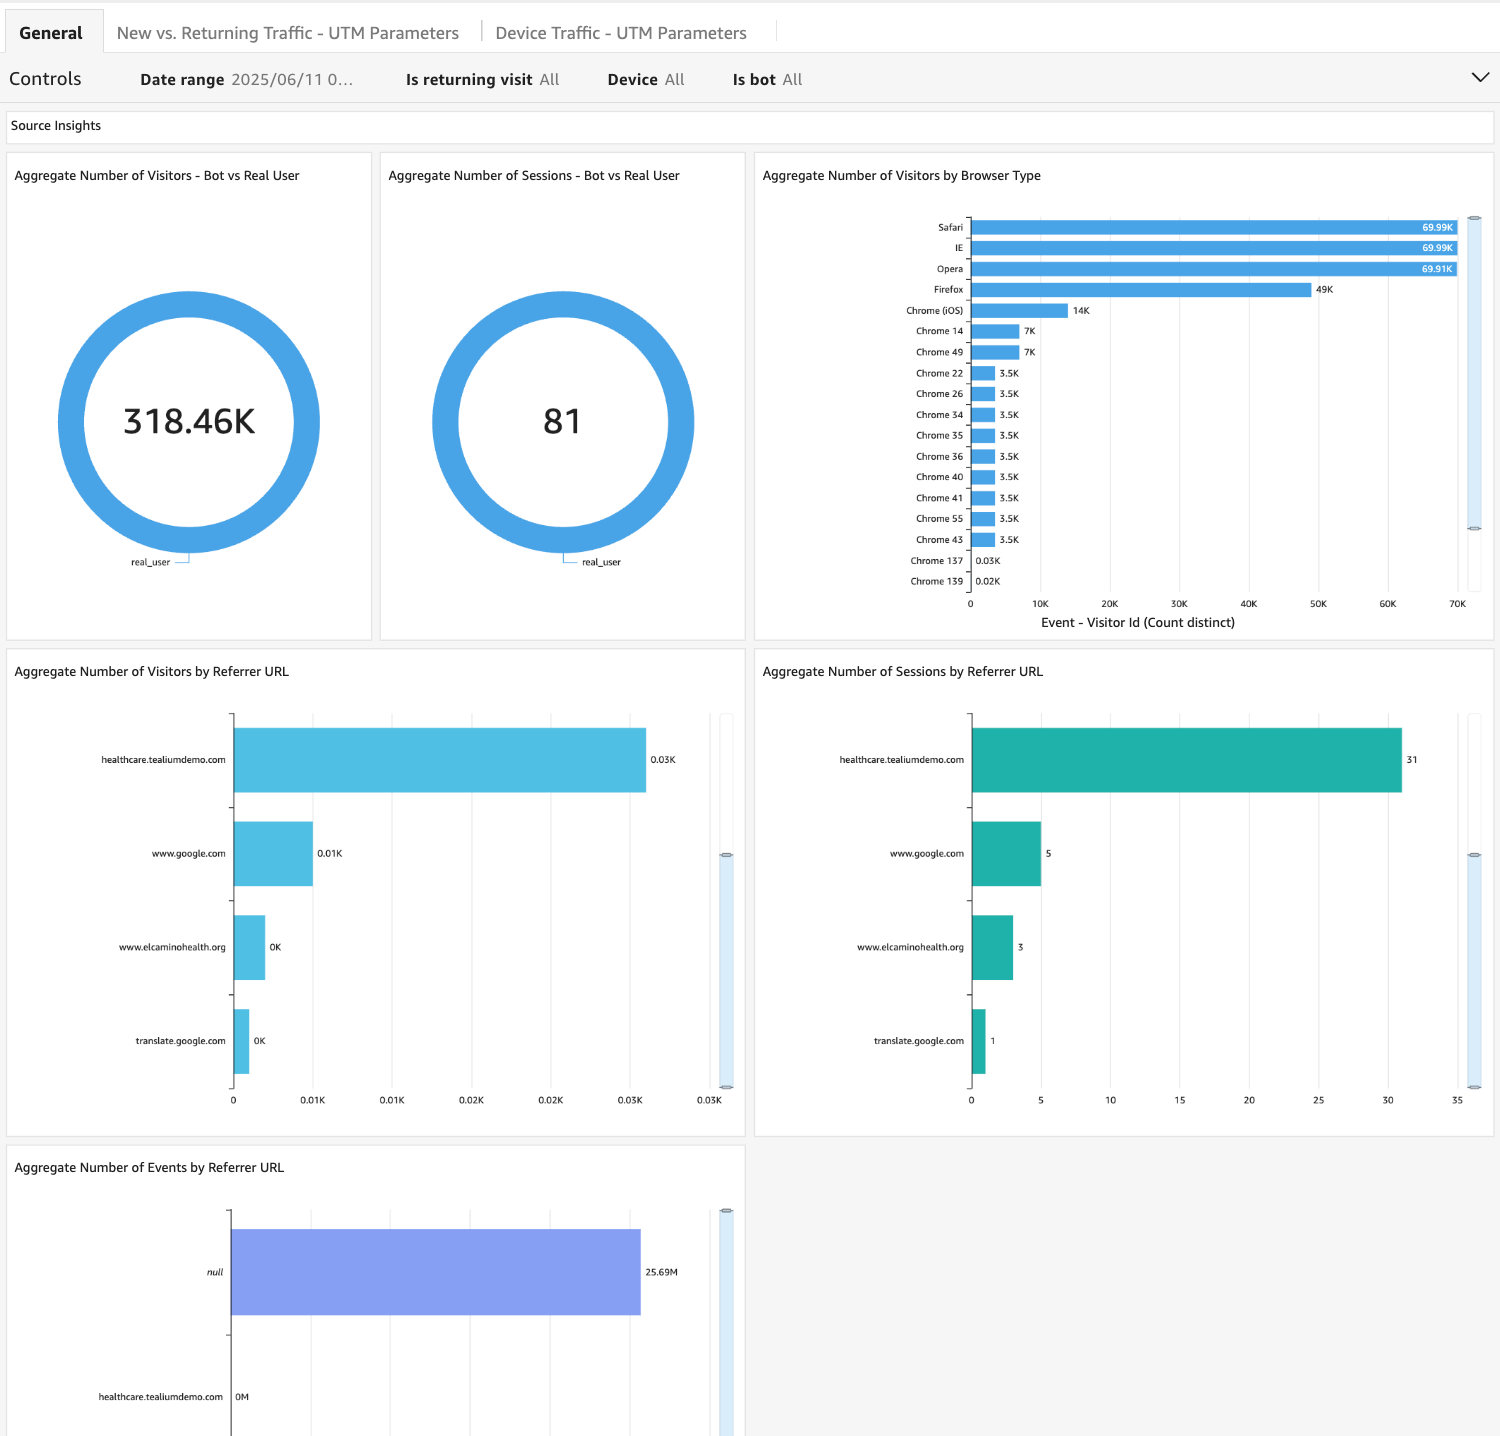
Dashboard status
Dashboards created from templates may display a status label, such as Generated or Update available.
For more information, see Template status.
This page was last updated: July 29, 2026