This article describes usage reports and how to access them.
How it works
Usage reports show the volume of data and number of operations associated with your account or profile. Use these reports to analyze the amount of data flowing through each point of the data supply chain and to estimate your billing costs for each feature.
Reports are available for all profiles in the account or for a specific profile. Report data can be adjusted to a specific date range.
Billing estimation
Usage costs for Tealium Event Streaming, Tealium EventDB, and Tealium EventStore, as well as customers with Tealium Collect and CDH bundles, are calculated based on the Total Inbound Events report. This report represents the total volume of events flowing into your account.
Usage costs for Tealium Customer Data Platform (CDP), Tealium AudienceDB, Tealium AudienceStore, and Tealium Predict are calculated based on the Total Real-Time Customer Data Platform Events report.
Every event, at its point of entry into the Tealium Customer Data Hub, counts towards the total volume and is charged equally.
Usage reports track audience fill events for visibility, but fill events do not count toward your contracted event volume. For more information, see Fill an audience.
Usage reports do not provide billing or pricing information. Your final usage cost is determined by a combination of your event volume, your contract terms, and your implementation setup. Contact your account manager for all billing and pricing inquiries.
Graph format
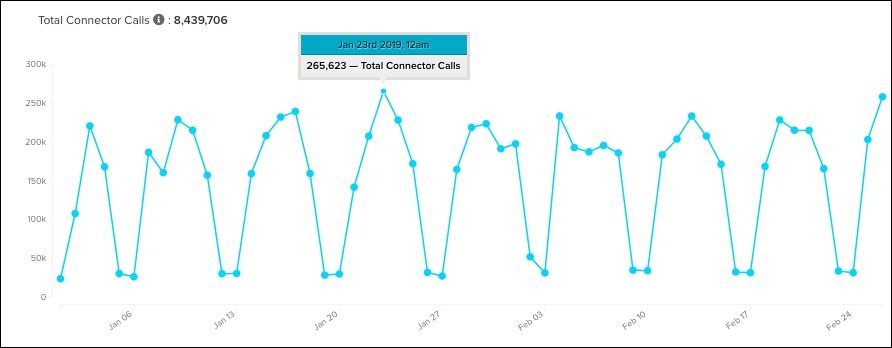
Reports are displayed as line graphs. The date range is plotted on the horizontal axis and the metric is plotted along the vertical axis and marked by dots. Hovering over a dot displays the aggregate metric values and the day on which it was aggregated.
Available reports
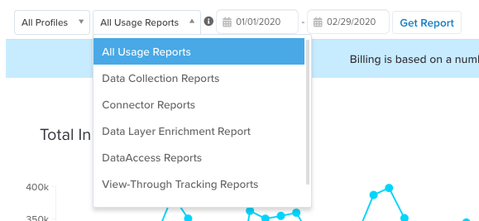
The following lists describe the available report types.
- All Usage Reports
Displays all reports sequentially in the reports dashboard. This is the default view.
Connector Reports
Connector reports correspond to event usage by connectors and return the following reports:
- Total Connector Calls
Total server requests made for triggering Event Streaming and Customer Data Platform connector actions. - Connector Calls - Event Streaming
Number of server requests made by Event Streaming connector actions. The number of connector calls contracted with Event Streaming is based on this report. - Connector Calls - Customer Data Platform
Number of server requests made by Customer Data Platform connector actions. - Connector Calls - Data Cloud Activation
Number of server requests made by Data Cloud Activation connector actions. This report is only available for accounts with Data Cloud Activation.
DataAccess Reports
DataAccess reports show the number of records stored in AudienceStore, EventStore, AudienceDB, and EventDB:
- Total DataAccess Records Inserted
The number of event and visitor records stored for all DataAccess products. - Total EventDB Events Inserted
The number of event records inserted to EventDB. - Total EventStore Events Inserted
The number of event records stored in EventStore. - Total AudienceDB Visitors Inserted
The number of visitor records inserted to AudienceDB. - Total AudienceStore visitors Inserted
The number of visitor records stored in AudienceStore.
Data Collection Reports
Data Collection reports correspond to real-time and offline events flowing into your Customer Data Hub profile and return the following reports:
- Total Inbound Events
The total of real-time and file import events. Data usage cost for Event Streaming is calculated based on the Total Inbound Events report. - Total Real-time Events
The number of events the Tealium Collect tag captures from your website or mobile app in the date range specified. For more information, see Live Events and Feeds. - Total File Import Events
The number of file import rows or lines imported into Customer Data Platform. - Total Omnichannel Events
For users of the legacy Omnichannel feature. The number of Omnichannel rows or lines imported into Customer Data Platform. - Total Data Cloud Events
The number of events imported from Data Cloud Activation data sources. - Data Cloud Activation: Total Number of Events (Data Records) Received
The total number of data records received by Data Cloud Activation. This report is only available for accounts with Data Cloud Activation. - Total Customer Data Platform Events
The total number of events received by Customer Data Platform. If the AudienceStream event filter is enabled, this report only includes filtered Customer Data Platform events. - Total Real-Time Customer Data Platform Events
The number of real-time events received by Customer Data Platform. This graph does not include Omnichannel, File Import, or Data Connect events. If the AudienceStream event filter is enabled, this report only includes filtered Customer Data Platform events. - Bulk Customer Data Platform Events
The number of offline and bulk events received by Customer Data Platform. This graph includes Omnichannel and File Import events. If the AudienceStream event filter is enabled, this report only includes filtered Customer Data Platform events.
Total Real-time Events vs. Total Customer Data Platform Events
The number of real-time events may not match the number of Customer Data Platform events due to any of the following expected reasons:
- Filtered events
If the AudienceStream event filter is set, only events that match the filter are processed. - Consent
If consent is in use, Customer Data Platform will not process events unless the visitor has opted into the CDP consent category. For more information, see AudienceStream processing. - Exceeding data size limits
To ensure the stability of the platform, event or visitor data exceeding specified size limits may not be processed. These measures safeguard against overloading the system to maintain optimal performance for all customers. For more information, see Size limits.
Tealium calculates data usage cost for Customer Data Platform based on the Total Customer Data Platform Events report.
Data Connect Reports
- Total DataConnect Records
The number of records stored. - Total DataConnect Kb
The storage size of all records (in kilobytes). - Total DataConnect Workato Tasks
The number of Workato tasks performed.
Data Layer Enrichment Reports
Data Layer Enrichment reports correspond to the Customer Data Platform Data Layer Enrichment service.
- Total CDP Data Layer Enrichment Calls
The number of times the Tealium Collect tag made requests to the Customer Data Platform data layer for fetching visitor profiles.
Functions Reports
Functions reports show the number of functions triggered and the total execution time of functions by function type.
- Total Invocations Custom Actions
The total number of event and visitor functions triggered. - Total Invocations Transformations
The total number of data transformation functions triggered. - Total Execution Time Custom Actions, hours
The total execution time of all event and visitor functions. - Total Execution Time Transformations, hours
The total execution time of all data transformation functions.
Insights Reports
- Insights Spice
The SPICE memory capacity (in megabytes) in use. - Insights Authors
The number of author roles allocated to your Insights account. - Insight Readers
The number of reader roles allocated to your Insights account.
Predict Enrichments
The Predict enrichments report shows how many times a deployed model sets a predictive output value in the associated attribute.
View-Through Tracking Reports
- Total View-Through Tracking Writes
The number of writes performed by the view-through tracking service. - Total View-Through Tracking Reads
The number of reads performed by the view-through tracking service.
For more information, see View-Through Tracking Extension.
View reports
To view usage reports, navigate to Analyze > Usage. The default view is for all profiles and all product features.
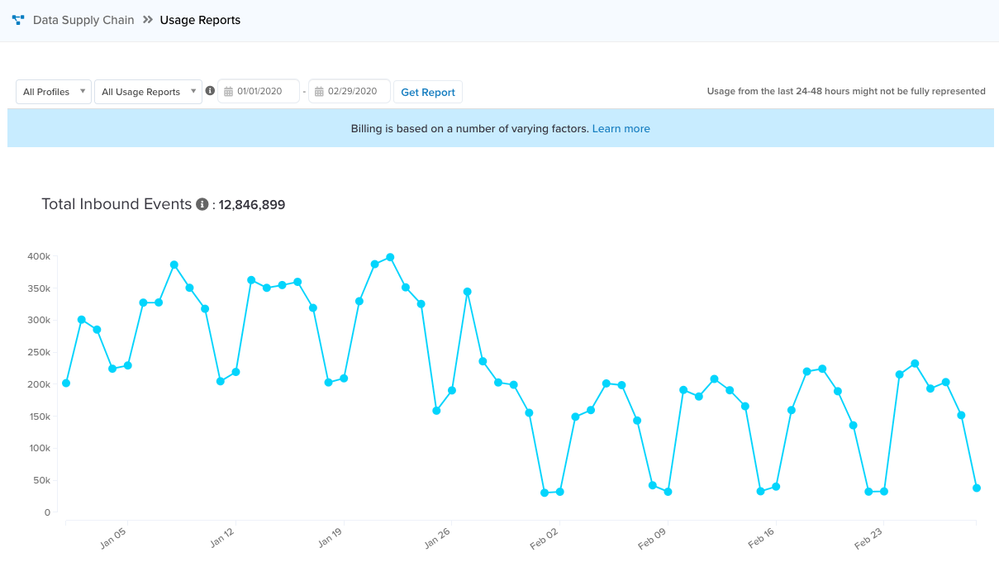
To view reports for a specific profile, feature, or date range:
- Select a profile and feature type from the drop-down lists.
- Click the start date or end date to adjust the date range for the report.
The default date range is set for January 1 of the current year to the current date. To change the default, contact your account administrator. - Click Get Report.
FAQ
Why can’t I see data for today in my reports?
Usage reports can take up to 48 hours to completely process and update. If your date range only spans the last 24-48 hours, you may not see data populated in the reports. Choose a start date that is three or more days before the current date.
Why can’t I choose a date prior to April 1, 2016?
Usage reports provide data for up to one year from the time of their release. This method provides most accounts with the data they need to evaluate their annual billing cycle.
This page was last updated: August 18, 2026