Connector error logging
This article explains how to configure connector error log sources, review log parameters, and troubleshoot connector errors.
Log streaming is in Early Access and is only available to select customers. If you are interested in trying this feature, contact your Tealium Support representative.
How it works
When a monitored connector action returns an error, Tealium generates a structured JSON log record and forwards it through the log source to the associated destination connector. The destination platform indexes these records for dashboards, alerts, and analysis.
For an overview of how destinations and log sources work together, see About log streaming.
Configure connector error logging
To create a log source, see Create a log source.
When using the Connector Errors log source type:
- Select the connectors to monitor.
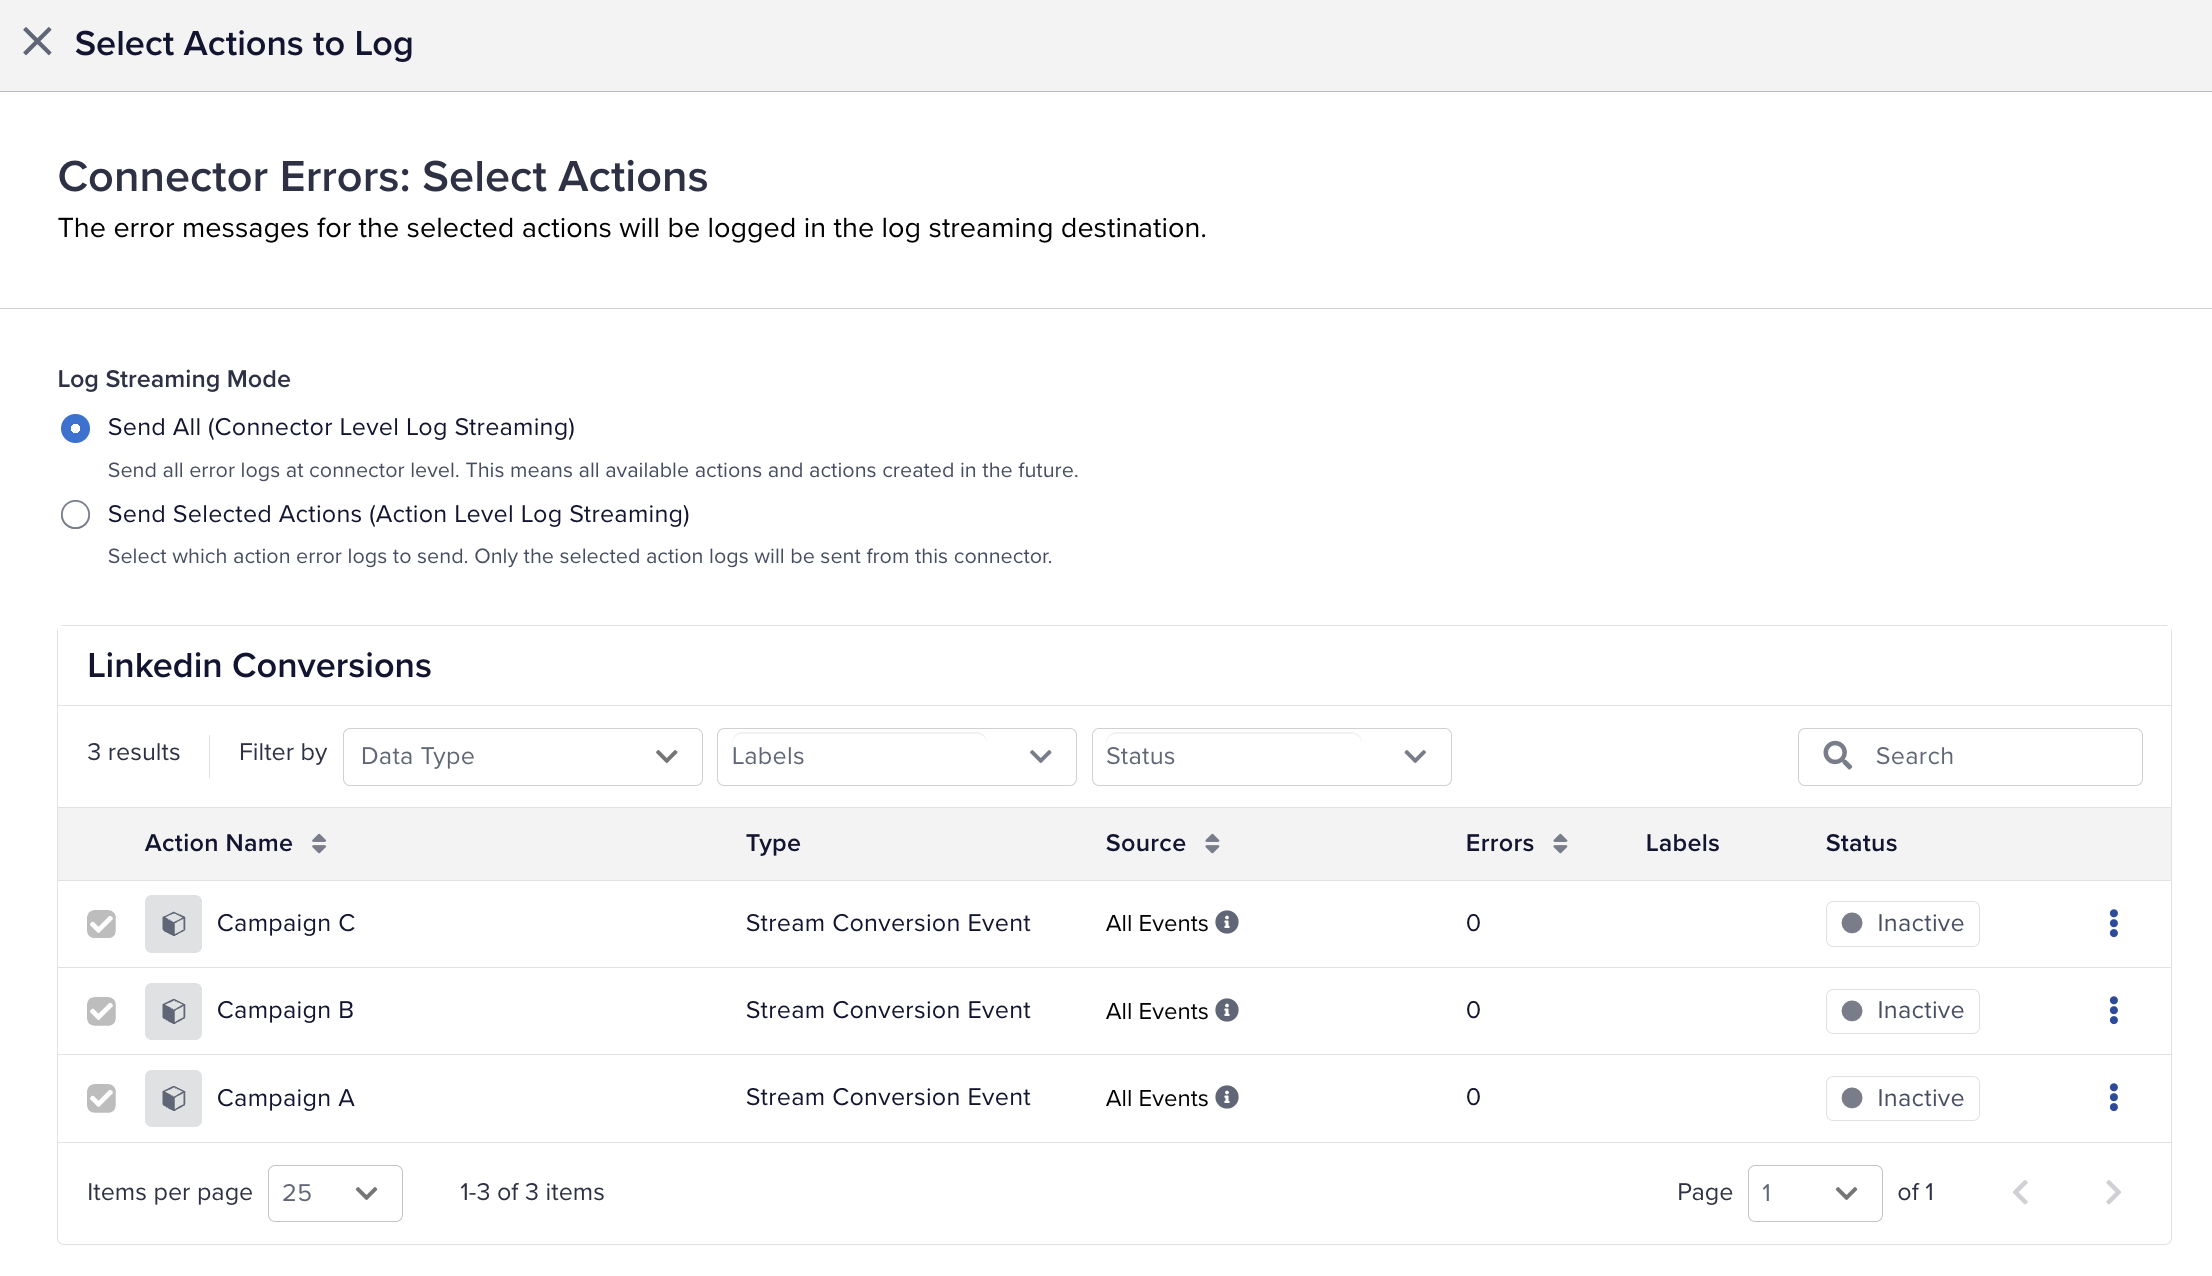
- Choose whether to log all actions or only selected actions.
- Map event attributes to the parameters required by your destination.
Each log source can be scoped to:
- All connectors and actions
- Specific connectors or actions, such as a single campaign
To limit log volume, select specific actions rather than logging all actions for a connector.
View connector error log source details
Click any connector error log source in the Log Sources table of a destination to view its details:
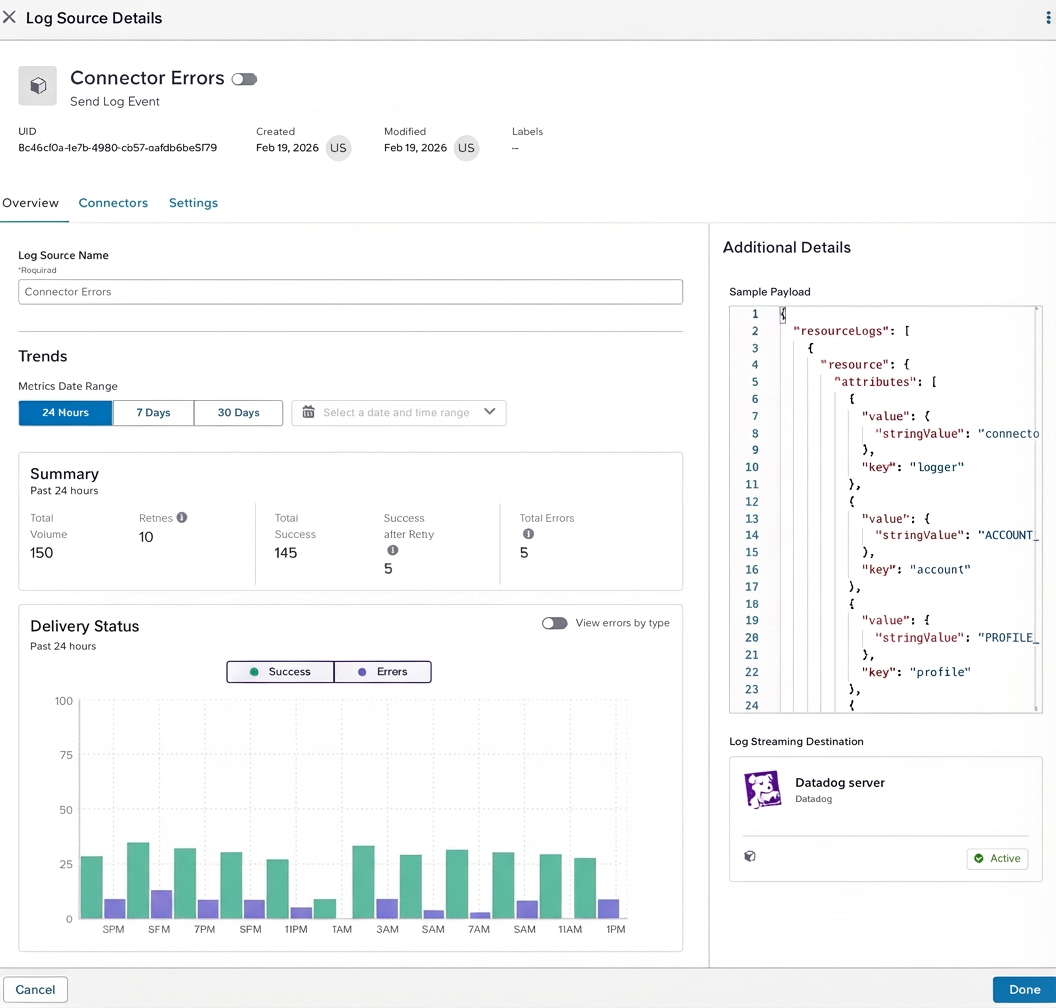
Overview tab
The Overview tab shows:
- Basic information (name, notes, UID, labels)
- A success and error trend chart
- Summary statistics for the selected time range
The following metrics are displayed:
-
Total Volume
Total number of log events sent in the selected time frame. -
Retries
Number of retry attempts for failed log deliveries. -
Total Success
Number of log events successfully delivered. -
Success after Retry
Number of events successfully delivered after one or more retries. -
Total Errors
Number of log events that failed delivery, including those that may have succeeded after retries.
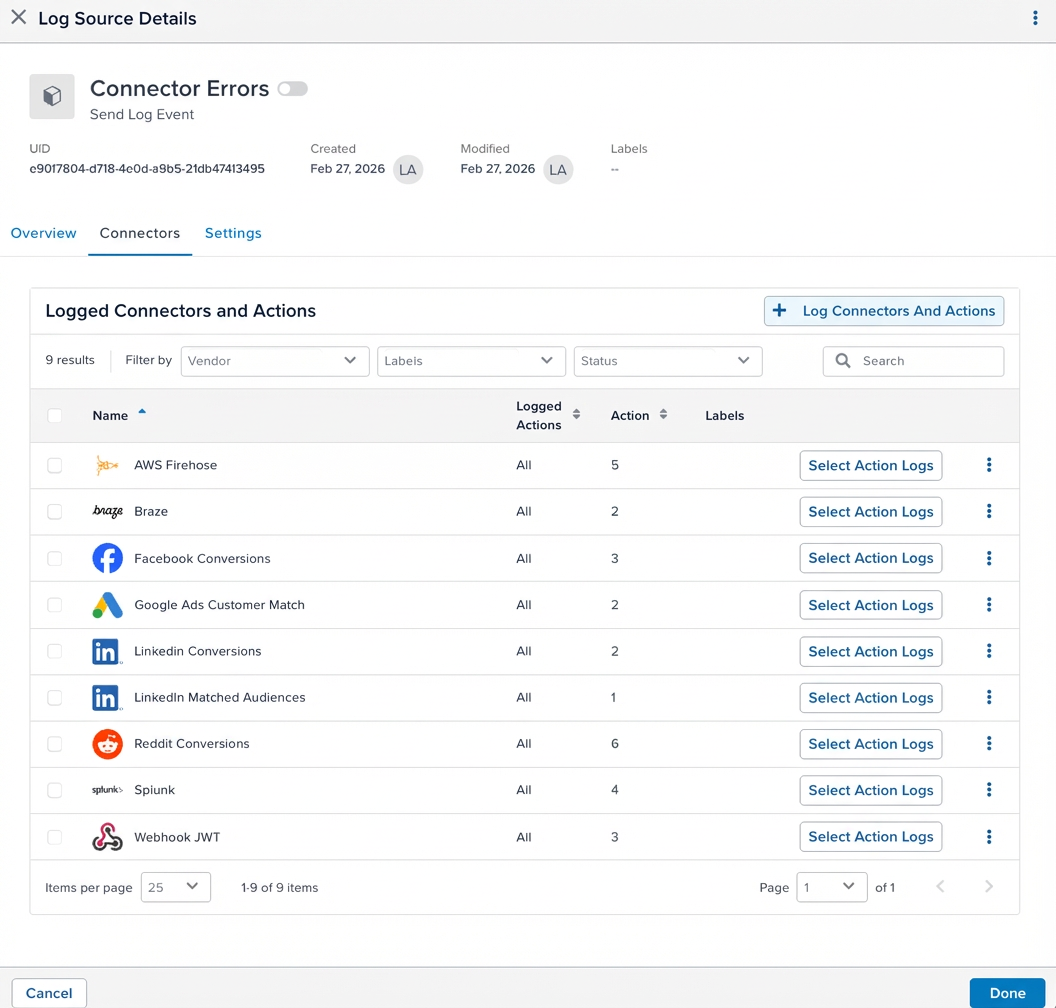
Connectors tab
The Connectors tab lists the connectors monitored by the log source, including:
- Total number of available actions
- Number of monitored actions
- Labels
Within each connector, you can select individual actions or monitor all configured actions:
Use logs to troubleshoot connector errors
Use the logs generated by connector error logging to identify, classify, and resolve issues in connector executions.
Confirm scope and impact
- In the connector interface, review the delivery graph (success vs. errors) for the past 1, 7, and 30 days.
- Identify which connectors and actions are affected and when errors started.
- Export metrics and sampled errors for further analysis.
Classify error types
Use logs to categorize errors:
-
4xx errors (for example, “invalid ID”, “not found”)
Typically indicate data or configuration issues. -
429 or 5xx errors
Usually indicate vendor rate limits or outages. -
Timeout errors
Occur when the vendor does not respond within five seconds. Timeout errors are not retried.
Apply the appropriate fix
- Data or configuration errors: fix mappings, correct IDs, and ensure required identifiers are present.
- Vendor limits or outages: coordinate with the vendor and reduce burst traffic if necessary.
- Platform throttling: resolve underlying issues and monitor recovery.
Misconfiguration or bad data
Typical causes:
- Missing or invalid identifiers in triggers
- Incorrect campaign or account IDs
- Missing required parameters
- Missing permissions or policies (for example, AWS IAM configuration)
Resolution:
- Review errors in the connector UI.
- Add conditions to ensure required data is present.
- Validate IDs against vendor systems.
- Correct configuration and permissions.
Vendor rate limits, timeouts, or outages
Typical causes:
- HTTP 429, 5xx, or gateway errors
- Vendor timeouts (no response within five seconds)
- Traffic spikes exceeding vendor capacity
Platform behavior:
- Tealium retries 429 and 5xx errors up to three times.
- Timeout errors are not retried.
- Retry behavior is controlled per connector.
Resolution:
- Review vendor logs.
- Increase vendor limits or capacity.
- Reduce burst traffic where possible.
- Monitor error rates over time.
Tealium overload protection
Typical causes:
- Sustained high failure rates
- Vendor instability or configuration issues
Platform behavior:
- If failure rates exceed thresholds, Tealium may pause or throttle the connector.
- Processing resumes gradually as error rates decrease.
Resolution:
- Resolve root causes quickly.
- Monitor recovery behavior.
- Contact Tealium Support if issues persist across connectors or regions.
Connector log parameters
The following table lists all available parameters in connector error logs. Reference these parameters in mappings using double curly braces (for example, {{connectorType}}).
| Parameter | Description |
|---|---|
logger |
Logging utility instance used to generate the event |
account |
Account where the connector is configured |
profile |
Profile where the connector is configured |
customId |
Connector action ID. To find this value, click the connector, then click the action, and then click Details. |
severityNumber |
Numeric severity level |
severityText |
Text severity level (for example, ERROR) |
connectorType |
Connector vendor name |
groupId |
Identifier that groups logs for a specific connector action execution |
result.executionTimeMs |
Execution duration in milliseconds |
result.status |
Execution result: SUCCESS or FAILURE |
result.failure.code.name |
Error type name (for example, API Error) |
result.failure.code.id |
Numeric error type identifier |
actionType |
Type of connector action (for example, send_events) |
streamType |
EVENT or VISITOR |
result.failure.errorsCount |
Total number of errors in the execution |
result.failure.code.description |
Human-readable error description |
recordSendDateTime |
Date and time when the log record was sent |
actionsCount |
Number of actions executed in the log event |
dimension |
Categorization field set by the agent before sending to the destination (for example, LOG_LEVEL_ERROR) |
timestamp |
Time the event occurred |
visitorId |
Visitor identifier (tealium_visitor_id). For batch connectors, only one visitor ID from the batch is referenced. |
http.0.response.body |
HTTP response body |
result.failure.error.0.message |
Specific error message describing the failure |
http.0.response.statusCode |
HTTP response status code (for example, 404, 500) |
http.0.executionTimeMs |
HTTP request execution time in milliseconds |
result.failure.error.0.count |
Occurrence count for a specific error type |
The number in parameter names (for example, http.0.executionTimeMs) represents the sequence of HTTP calls made during execution. If multiple calls occur, the number increments for each request: http.0 for the first call, http.1 for the second, and so on.
Example log
Connector error log entries use the OpenTelemetry Protocol (OTLP) ResourceLogs JSON format. The payload is structured as follows:
resourceLogs[].resource.attributes[]: Resource-level fields that identify the source, such asaccount,profile, andcustomId.resourceLogs[].scopeLogs[].logRecords[].attributes[]: Event-level fields containing error details, such asconnectorType,http.0.response.statusCode, andresult.failure.code.name.
Each attribute is a key-value pair where the value is typed (for example, stringValue or intValue).
The following example shows a connector error log:
{
  "resourceLogs": [
    {
      "resource": {
        "attributes": [
          {
            "value": {
              "stringValue": "connector-errors"
            },
            "key": "logger"
          },
          {
            "value": {
              "stringValue": "ACCOUNT_NAME"
            },
            "key": "account"
          },
          {
            "value": {
              "stringValue": "PROFILE_NAME"
            },
            "key": "profile"
          },
          {
            "value": {
              "stringValue": "12345678-1234-1234-1234-123456789012"
            },
            "key": "customId"
          }
        ]
      },
      "scopeLogs": [
        {
          "scope": {},
          "logRecords": [
            {
              "severityNumber": 17,
              "severityText": "ERROR",
              "attributes": [
                {
                  "value": {
                    "stringValue": "webhook"
                  },
                  "key": "connectorType"
                },
                {
                  "value": {
                    "stringValue": "404 Not Found"
                  },
                  "key": "http.0.response.body"
                },
                {
                  "value": {
                    "stringValue": "Error: received non-successful http response status = 404"
                  },
                  "key": "result.failure.error.0.message"
                },
                {
                  "value": {
                    "stringValue": "e71684df-90e6-4c4d-8cb2-695da67402a0"
                  },
                  "key": "groupId"
                },
                {
                  "value": {
                    "intValue": "368"
                  },
                  "key": "result.executionTimeMs"
                },
                {
                  "value": {
                    "intValue": "1"
                  },
                  "key": "result.failure.error.0.count"
                },
                {
                  "value": {
                    "stringValue": "FAILURE"
                  },
                  "key": "result.status"
                },
                {
                  "value": {
                    "stringValue": "API Error"
                  },
                  "key": "result.failure.code.name"
                },
                {
                  "value": {
                    "intValue": "404"
                  },
                  "key": "http.0.response.statusCode"
                },
                {
                  "value": {
                    "intValue": "1"
                  },
                  "key": "result.failure.code.id"
                },
                {
                  "value": {
                    "stringValue": "send_events"
                  },
                  "key": "actionType"
                },
                {
                  "value": {
                    "intValue": "226"
                  },
                  "key": "http.0.executionTimeMs"
                },
                {
                  "value": {
                    "stringValue": "EVENT"
                  },
                  "key": "streamType"
                },
                {
                  "value": {
                    "intValue": "1"
                  },
                  "key": "result.failure.errorsCount"
                },
                {
                  "value": {
                    "stringValue": "An error occurred communicating with the vendor"
                  },
                  "key": "result.failure.code.description"
                },
                {
                  "value": {
                    "stringValue": "2024-12-03T19:26:44.921+0000"
                  },
                  "key": "recordSendDateTime"
                },
                {
                  "value": {
                    "intValue": "1"
                  },
                  "key": "actionsCount"
                },
                {
                  "value": {
                    "stringValue": "LOG_LEVEL_ERROR"
                  },
                  "key": "dimension"
                },
                {
                  "value": {
                    "stringValue": "2024-12-03T19:26:44.920978481Z"
                  },
                  "key": "timestamp"
                },
                {
                  "value": {
                    "stringValue": "5be887275efa4ea08137f3ea8b253e59"
                  },
                  "key": "visitorId"
                }
              ]
            }
          ]
        }
      ]
    }
  ]
}
This page was last updated: May 27, 2026