Manage log streaming
This article explains how to configure, verify, and manage log streaming destinations and log sources.
Log streaming is in Early Access and is only available to select customers. If you are interested in trying this feature, contact your Tealium Support representative.
Enable log streaming
- Go to Server-Side Settings > Log Streaming.
- Turn on Enable Log Streaming.
- Save and publish the profile.
Create a destination
Create one destination for each external system that receives logs.
For example:
- Create a Datadog destination for monitoring and alerting.
- Create an Amazon S3 destination for long-term storage and auditing.
To create a destination:
- In the admin menu, click Manage Log Streaming.
- Click + New Destination.
- Select a connector and click Next.
- Turn on Status to enable the destination.
- Enter a Name for the destination.
- (Optional) Enter any Notes to describe the destination.
- Configure authentication and connection settings. The required fields vary based on the connector you select.
- Click Test Connection to verify connectivity.
- Click Done.
Each destination has its own configuration requirements. Refer to the connector documentation for required fields and supported parameters. For a list of available connectors, see Available destination connectors.
Create a log source
Log streaming counts toward your outbound event connector calls. Monitor only the connectors and actions necessary for your use case.
To create a log source:
-
Open the log source dialog using one of the following:
- From the Manage Log Streaming table, click + New Source in the destination row.
- Select a destination, then click + New Source.
-
In the New Log Source dialog:
-
Enter a Log Source Name.
-
Select a Log Streaming Scope:
- Send Entire Log Event: Sends all log attributes in the payload.
- Send Log Event: Sends only mapped attributes in the payload.
If only one option is available, it is selected by default. For more information, see Available destination connectors.
-
The Log Source Type is set to Connector Errors.
-
Review the sample payload on the right to understand the available fields.
-
Click Continue.
-
-
Select connectors to monitor:
- Choose one or more connectors from the list.
- To refine what is logged, click Select Action Logs for a connector.
-
Configure action-level logging (optional):
- In the Select Actions to Log dialog, choose a Log Streaming Mode:
- Send All (connector-level logging)
Sends error logs for all actions in the connector, including actions added later. - Send Selected Actions (action-level logging)
Sends logs only for the selected actions.
- Send All (connector-level logging)
- If using Send Selected Actions, select the actions to monitor.
- Click Done.
- In the Select Actions to Log dialog, choose a Log Streaming Mode:
-
Click Done to save the connector selection.
Map event attributes to vendor parameters
After configuring a log source, map Tealium log attributes to the parameters required by your destination system in the log source Settings tab.
For information about available vendor parameters, see the documentation for your destination connector and action and the connector log parameters.
How mapping works
Log streaming runs in a separate pipeline from standard event processing. Regular event attributes from visitor or event data are not available in log streaming actions. Because of this separation, log parameter values must be explicitly promoted to event attributes before they can be mapped to destination fields.
Mapping involves two steps:
-
Create event attributes using enrichments
Create a string event attribute for each log field you want to send to your destination. Then add a set string enrichment to that attribute with the log parameter as the value, using double curly braces.
For example, to make the severity level available for mapping:
- Create a string event attribute named
dd_severity. - Add a set string enrichment with the value
{{severityText}}.
At delivery time, the enrichment extracts the value from the log record and writes it to the event attribute.
For the full list of available log parameters, see Connector log parameters.
- Create a string event attribute named
-
Map event attributes to destination parameters
In the log source settings, map the event attribute to the appropriate vendor parameter. The available parameters depend on the destination connector you are using.
For example, in the Datadog Send Log Event log source settings, map the event attribute
dd_severityto the Datadog Severity parameter.
Example mapping (Datadog)
The following example shows how to structure attributes for a Datadog destination:
| Event attribute | Set string enrichment |
|---|---|
dd_tags |
account:{{account}},profile:{{profile}},connector:{{connectorType}},action_id:{{customId}},status:{{result.status}},error_code:{{result.failure.code.name}},http_status:{{http.0.response.statusCode}},group_id:{{groupId}} |
dd_subject |
{{result.failure.code.name}} |
dd_content |
{{result.failure.error.0.message}} |
dd_severity |
{{severityText}} |
Then map those event attributes to vendor parameters in the log source Settings tab:
| Event attribute | Vendor parameter |
|---|---|
tealium_connector_errors |
DD Source |
dd_tags |
DD Tags |
tealium_server_side |
Hostname |
tealium_connectors |
Service |
tealium_timestamp_epoch |
Timestamp |
dd_subject |
Subject |
dd_content |
Content |
dd_severity |
Severity |
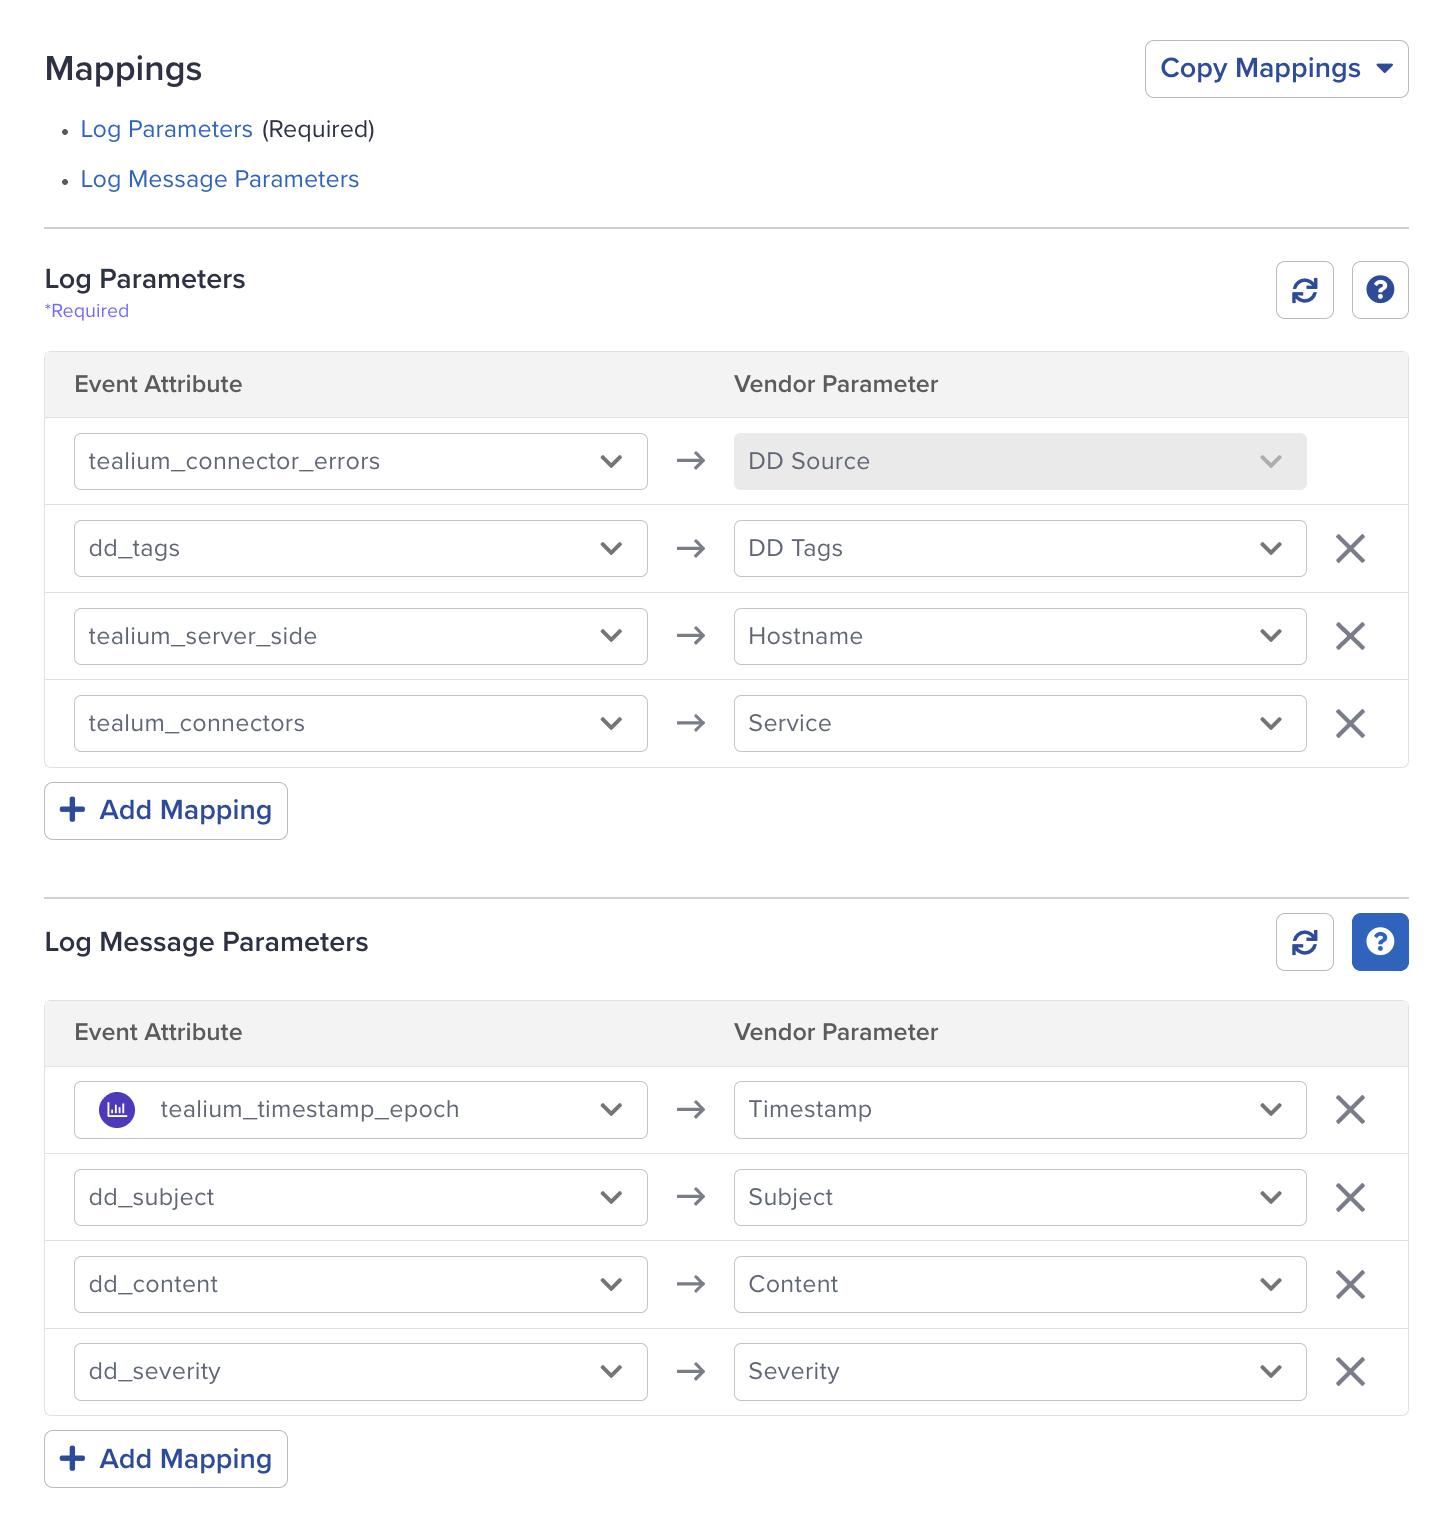
Use the sample payload in the log source view to confirm that the fields you reference exist and contain expected values.
For full parameter definitions, see Connector log parameters.
Verify delivery
After configuring a destination and log source:
- Confirm that logs are arriving in the destination system.
- Validate that fields are mapped correctly.
- Adjust mappings if fields are missing or incorrectly formatted.
In Tealium, use the log streaming dashboard to confirm that logs are being sent successfully.
Monitor log streaming activity
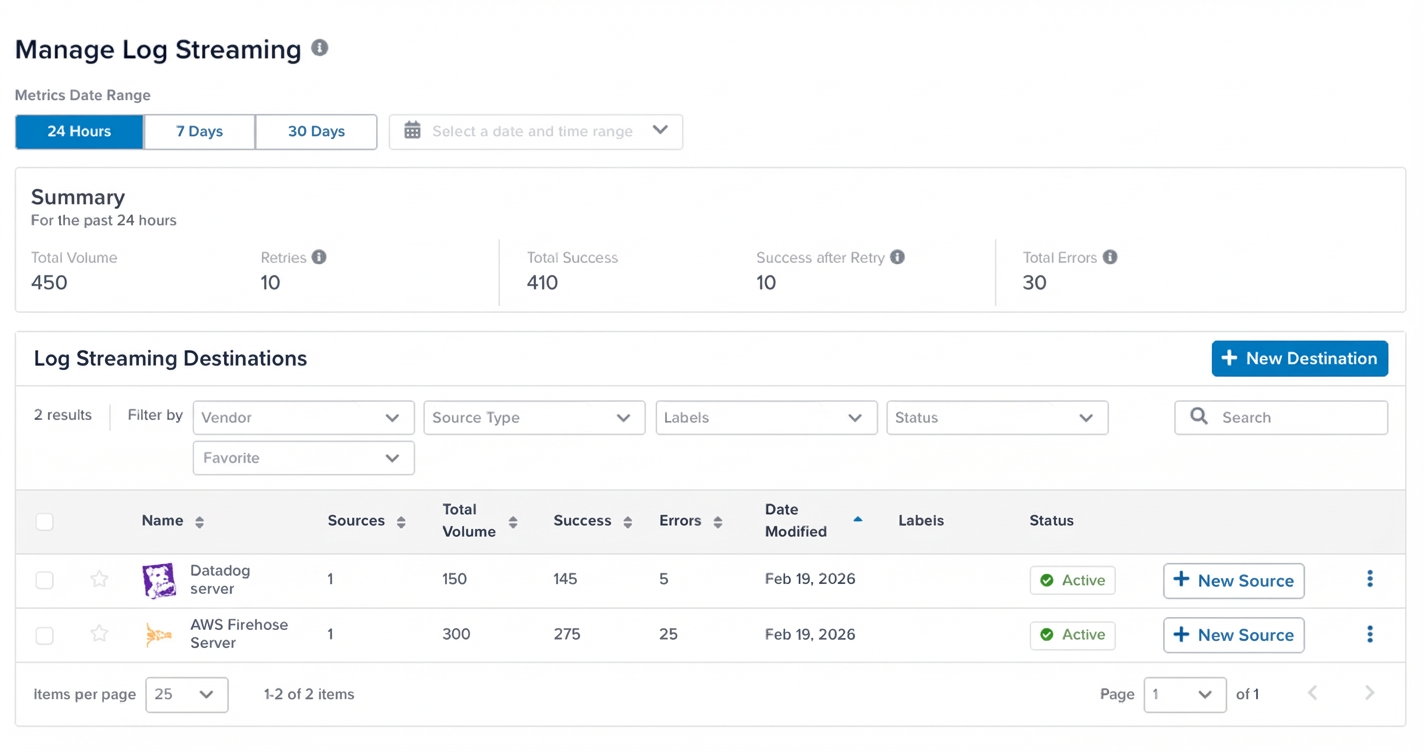
Use the Manage Log Streaming page to monitor delivery performance and manage destinations.
Summary metrics
The summary section shows delivery metrics for the selected time range.
- Total Volume: Number of log events sent
- Retries: Number of retry attempts
- Total Success: Successfully delivered events
- Success after Retry: Events delivered after one or more retries
- Total Errors: Events that failed delivery
These metrics reflect the health of the log delivery pipeline, not connector execution.
A high error count typically indicates issues such as:
- authentication failures
- connectivity issues
- destination configuration errors
Destinations table
The Log Streaming Destinations table lists all configured destinations and their delivery performance.
Each row shows:
- Sources: Number of log sources attached to the destination
- Total Volume / Success / Errors: Delivery metrics for the destination
- Date Modified: When the destination was last updated
- Labels: Labels applied to the destination
- Status: Whether the destination is active
Use this table to identify unusual patterns in volume or errors, then select a destination to investigate further.
View destination details
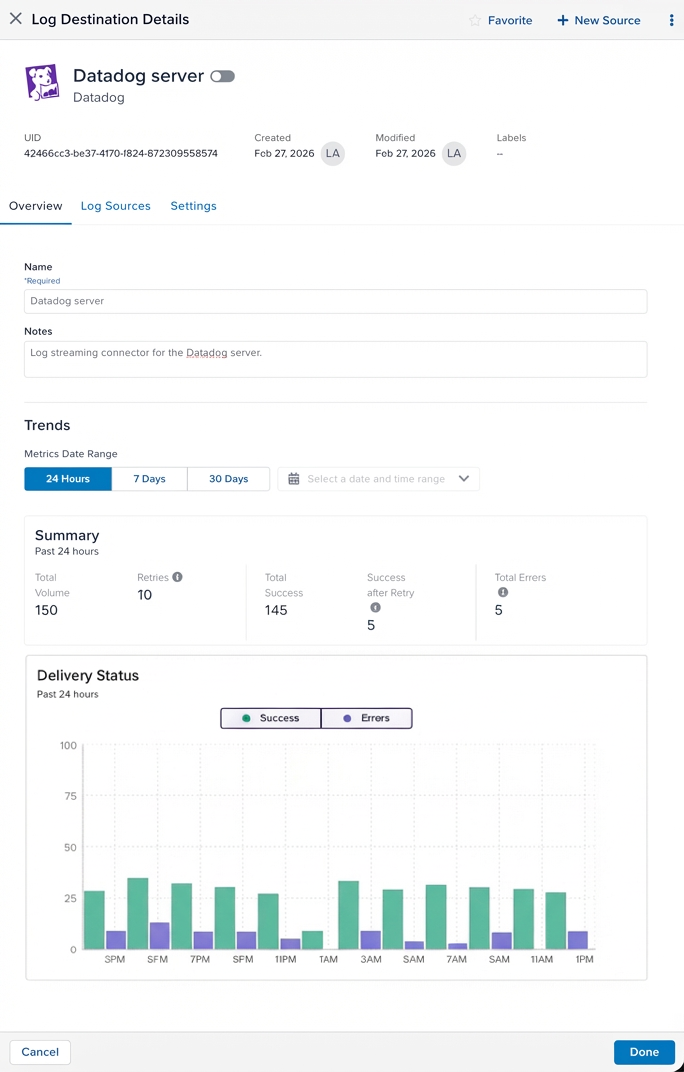
Select a destination to open its details. Use the following tabs:
- Overview: Delivery trend chart, summary statistics, and basic information (name, notes, UID, labels). Select a time period to filter the statistics and trend chart.
- Log Sources: Log sources attached to this destination, with type, status, and statistics (total volume, successes, and errors) for each. Includes options to duplicate or delete individual sources.
- Settings: Connector configuration (authentication fields, IDs, and connection parameters)
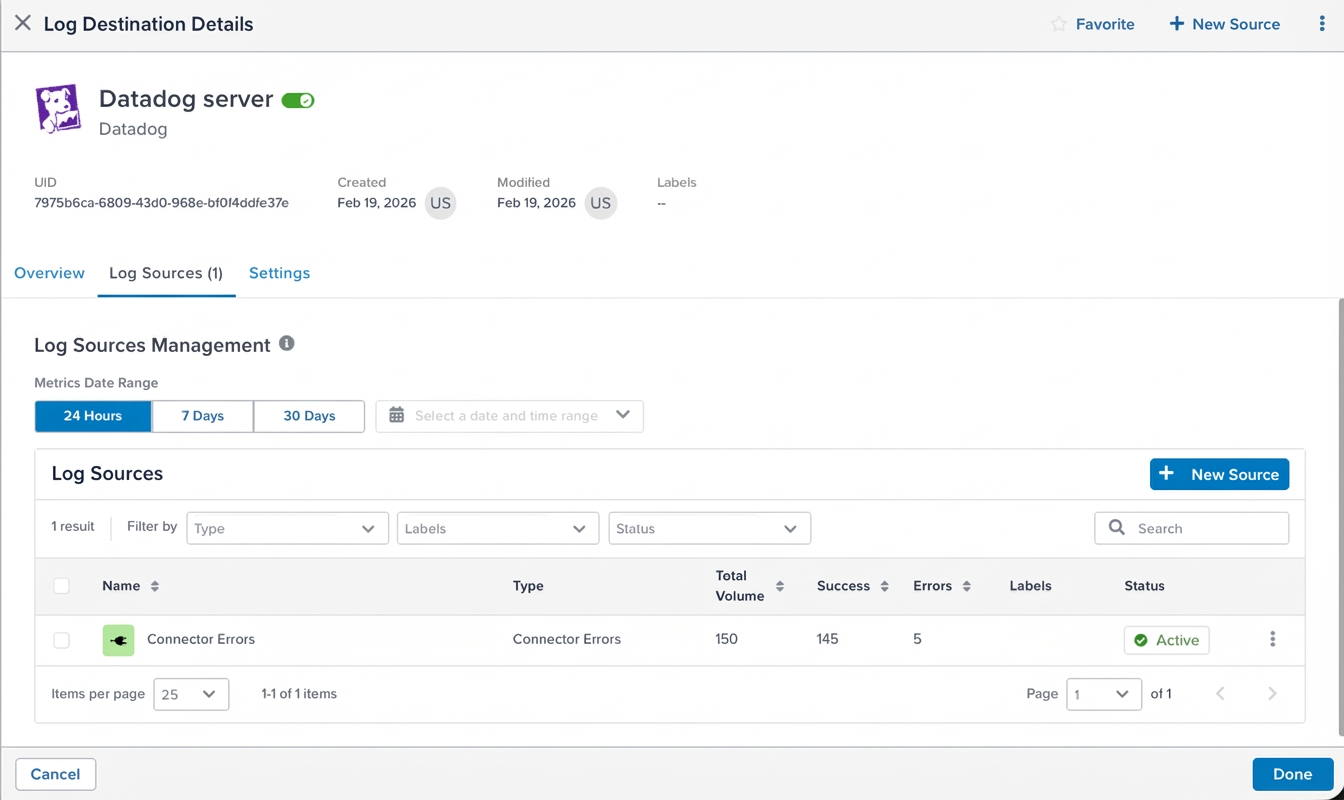
View log source details
Select a log source to open its details. Use the following tabs:
- Overview: Delivery trend chart and summary statistics. Select a time period to filter the statistics.
- Connectors: Connectors and actions monitored by this log source.
- Settings: Attribute mappings and sample payload. To reuse mappings across log sources, see Copy mappings.
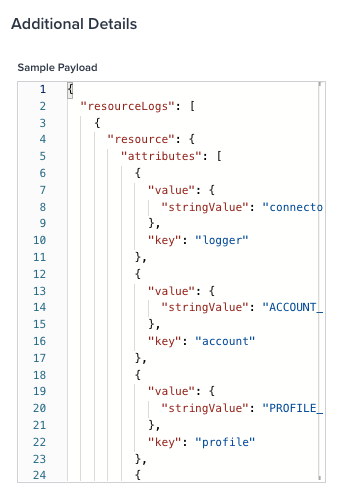
Use the sample payload to confirm that the fields you reference in mappings exist and contain expected values.
Copy mappings
Use Copy Mappings to reuse configurations across log sources.
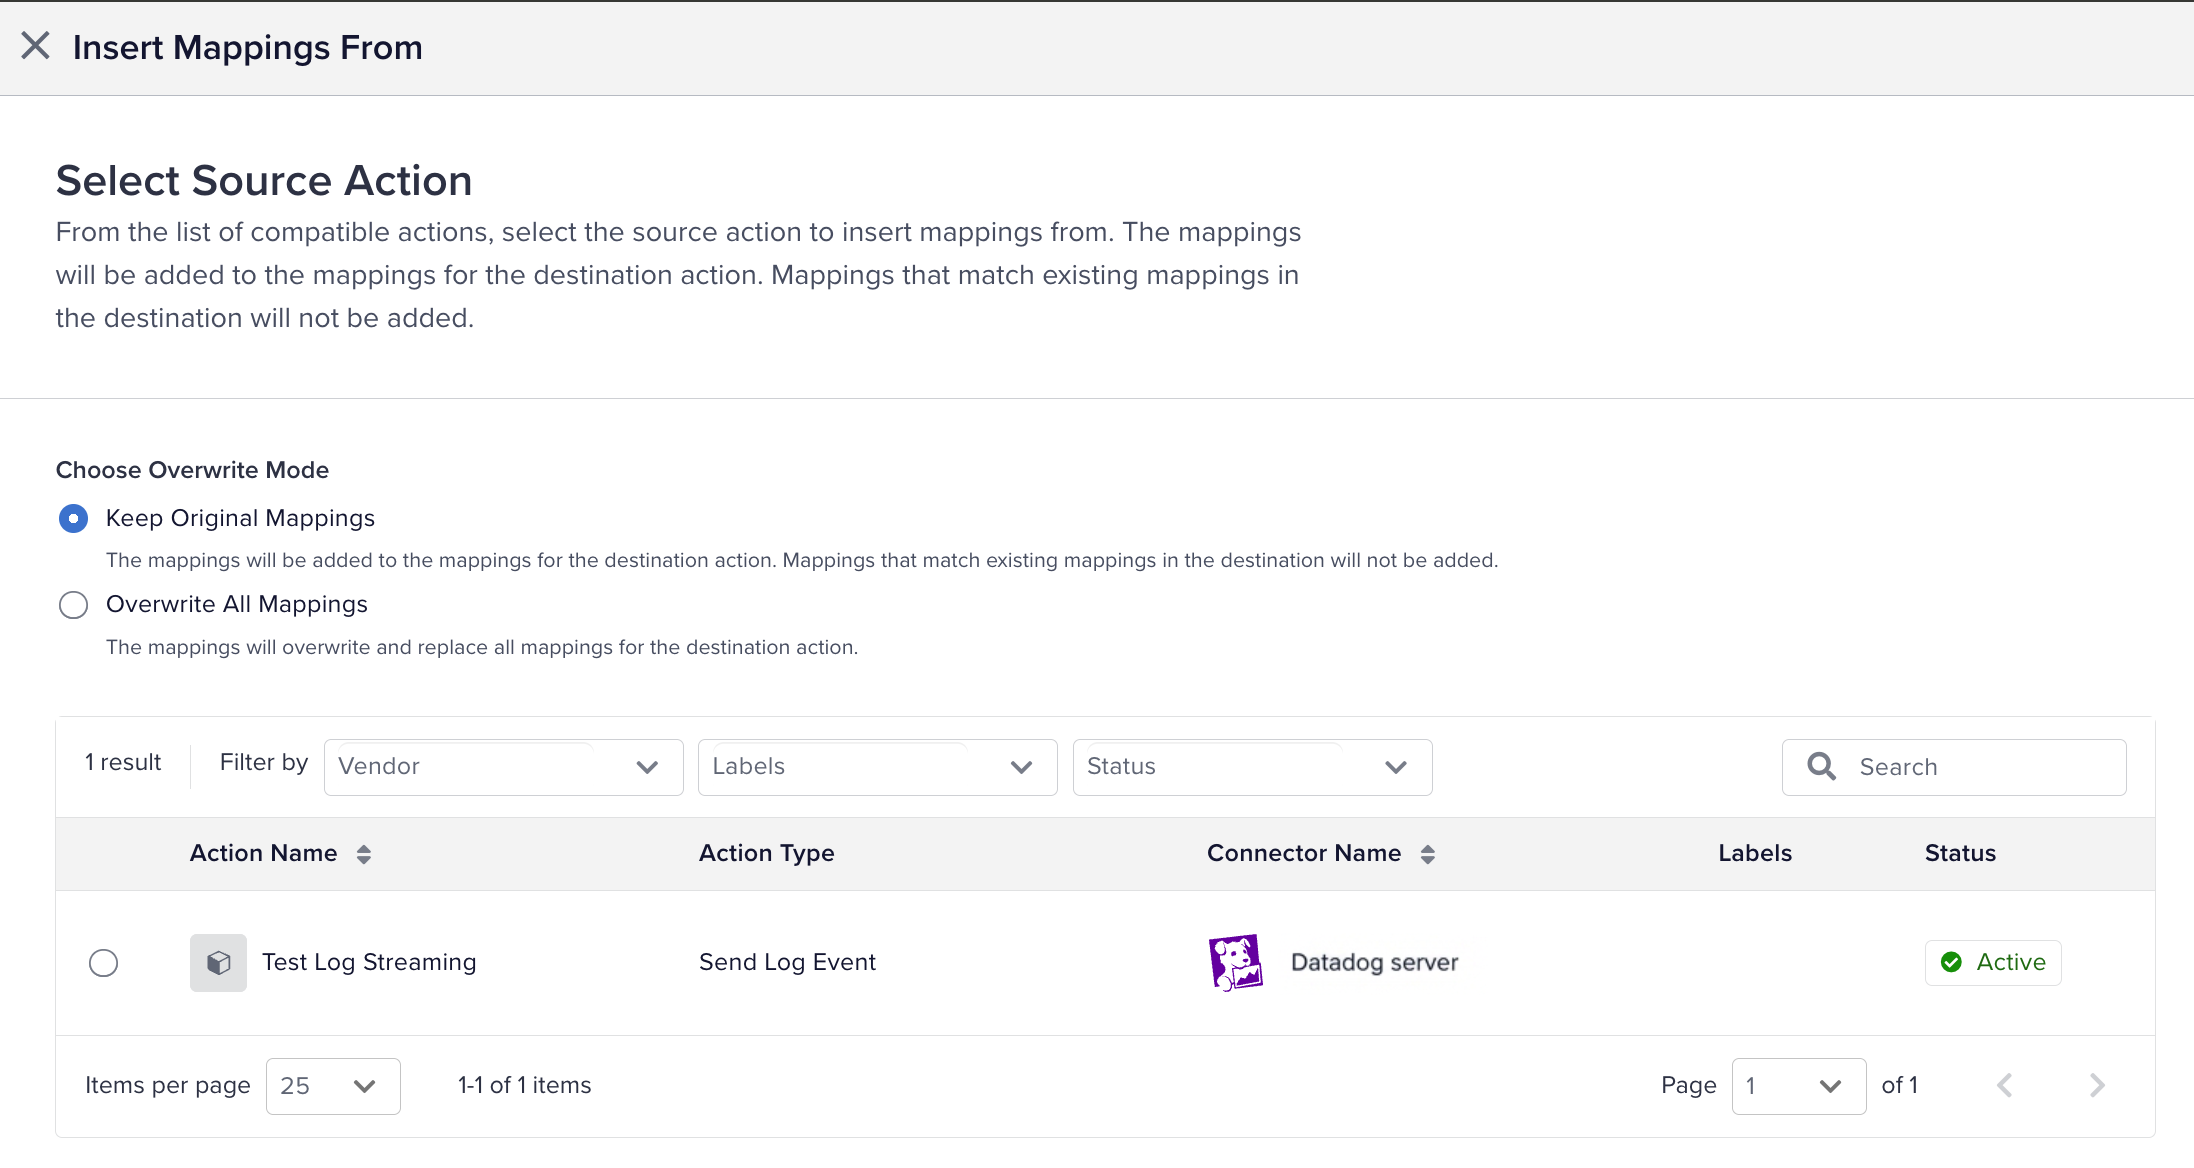
- Open a log source.
- Go to the Settings tab.
- Click Copy Mappings.
- Select one of the following:
- Insert Mappings From an Action: Copies mappings from the selected action to the current action.
- Copy Mappings to an Action: Copies mappings from the current action to the selected action.
- Choose how to handle conflicts:
- Keep Original Mappings: Adds new mappings from the source without modifying existing mappings in the destination.
- Overwrite All Mappings: Replaces all existing mappings in the destination with those from the source action.
- Apply filters or search to narrow the list of actions, then select the action.
- Click Done.
If you want to send the same log source to multiple destinations, create the additional destinations, add the log sources, and then use the copy mappings option to duplicate the mappings from one log source to the others.
Related resources
This page was last updated: June 5, 2026