Functions dashboard
This article provides information about the functions dashboard.
The Functions Dashboard feature is currently in early access and only open to select customers at this time. If you are interested in trying out this feature, please contact your account manager for information about early access.
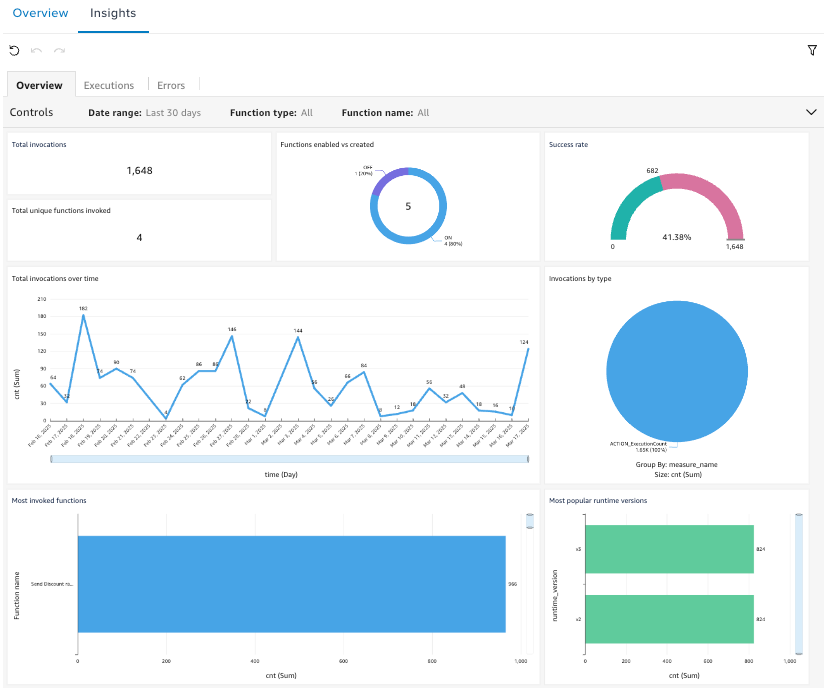
The Functions Overview screen has two tabs, Overview and Insights. The Insights tab displays visualizations and data about functions on three tabs, as follows:
- Overview tab
- Total invocations
- Total unique functions invoked
- Functions enabled vs created
- Success rate
- Total invocations over time
- Invocations by type
- Most invoked functions
- Most popular runtime versions
- Executions tab
- Minimum execution time (ms)
- Maximum execution time (ms)
- Average execution time (ms)
- Total execution time (ms)
- Total execution time over time (ms)
- Longest-running functions (ms)
- Average execution time over time (ms)
- Average execution time (ms)
- Errors tab
- Functions with errors
- Errors by function type
- Function with most errors
- Errors over time
- Dropped functions due to limits
- Dropped function logs due to limits
- Most dropped functions
- Dropped functions over time
The following figure shows an example of the functions insights visuals.
Turn on functions insights
Functions insights is off by default and can be turned on at any time. Use the following steps to turn on functions insights:
- On the Server-Side User Menu, select Server-Side Settings, then click Insights.
- Under Feature Insights, click the Functions Dashboard toggle to turn it on.
- Save and publish your changes.
If you turn off functions insights later on, the dashboard and its data are deleted 30 days after the change is published.
View functions insights
- Go to Server-Side > Functions > Overview.
- Click the Insights tab.
You may need to scroll down to see all of the graphs.
Update the functions insights template
If Tealium updates the functions insights dashboard, a message is displayed indicating that an update to the dashboard is available.
Use the following steps to update the dashboard:
- In the message, click View Updates.
Or go to Server-Side > Insights > Templates. - For the Functions Dashboard, click View Details.
- Click Update Dashboard.
- In the Confirm Update dialog, click Update.
Save and publish is not required after the update.
For more information about dashboards and templates, see About Tealium Insights and About templates.
This page was last updated: April 22, 2025