View a trace
This article describes how to use the overview panel and view the trace log.
Replay trace events
From the trace screen, you can replay, pause, or resume an event by clicking one of the icons in the trace summary.

The following table provides details on each of the trace icons.
| Icon | Description |
|---|---|
| Play at normal speed. The default setting used to replay an event is normal speed. | |
| Play at twice the normal speed. | |
| Pause the ongoing trace. When paused, trace continues to process new events behind the scenes but does not display new log entries until you click pause again to restart. | |
| View the latest visitor profile. Displays a snapshot of the profile for the latest visitor in JSON format. Click OK to exit this window. | |
Get code to replay events generates a curl command for each event. Run the curl commands in a terminal window to replay an event in trace without having to recreate the configuration steps on the web page.
|
|
| Exit the current trace. If the trace is still active on the web page, you can rejoin the trace using the Trace ID. |
View event details
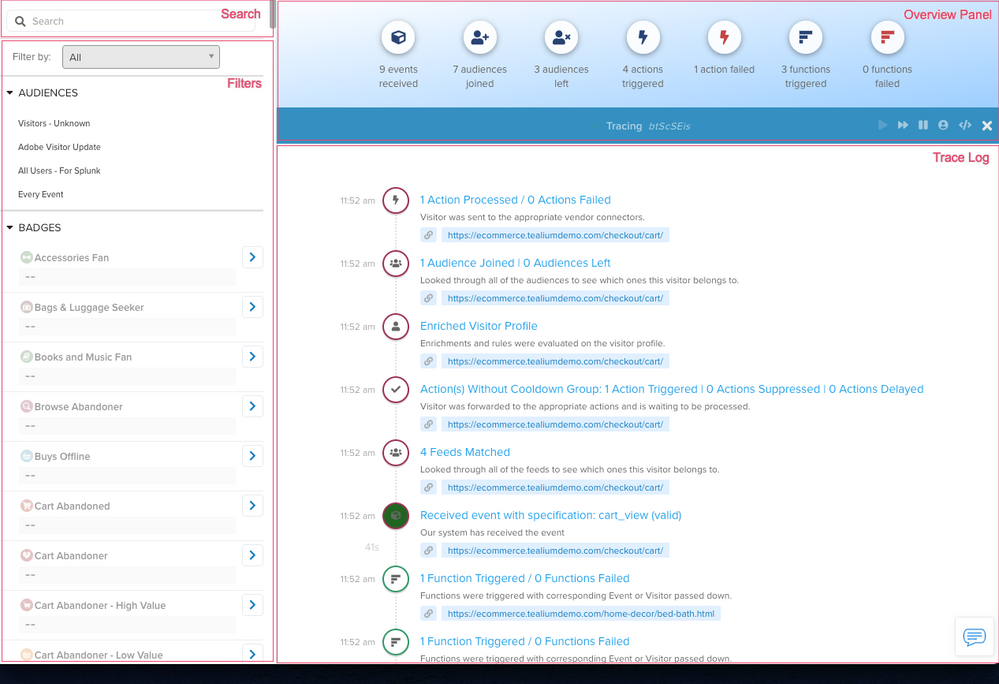
The following image shows the parts of the trace interface. The Trace Log is a real-time scrolling summary of actions, events, and audiences. The Overview Panel displays a snapshot of the detailed activity. Search can be used to find specific attributes in the list of visitor and visitor-scoped attributes. The attributes in the list are grouped by data type (numbers, dates, and so on). Filters can be used to filter these attributes.

Filters
Filtering lets you determine if the attributes and the configurations tied to them are functioning properly. Using filters, you can choose how to view the attributes and their values. Filter attributes by label (if you have added labels for attributes) or by Type, where Type is one of the following
- All
Shows all attribute types and values set up in your AudienceStream profile. - Existing
Shows only the attributes that acquired a value after AudienceStream processing. - Modified
Shows only the modified, or enriched, attributes.
Trace log
In the trace log, clickable text is blue, other text is gray. The timestamp adjacent to the log entry displays the time of the log entry. To view the details of an event, click the blue event text to slide out a detailed view of the event.
You can minimize the trace window to continue the process while moving on to other features of the UI.
The following table describes the meanings of various trace events:
| Trace event | Description |
|---|---|
| Actions Without Cooldown Group: No Actions Triggered | No vendor actions were triggered after checking cooldown groups. |
Actions Without Cooldown Group: x Actions Triggered / x Actions Suppressed / x Actions Delayed |
Shows the number of vendor actions triggered, suppressed, or delayed after checking cooldown groups. |
| Activation Blocked | The action was blocked by consent orchestration. |
| AudienceStream Processing Blocked | Consent orchestration blocked event processing. |
| Audience Joined | The visitor joined an audience after a profile update. |
| Audience Left | The visitor left an audience after a profile update. |
| Consent Orchestration Active | Consent orchestration is enabled for this account. |
| Consent Orchestration Exemptions Triggered | The action was exempted from consent orchestration. |
Cooldown Group group_name: x Actions Triggered |
After audience changes, cooldown groups are checked and actions are triggered as needed. |
| Data Record Import Failed | An imported data record failed to process. |
| Debug | Debug information from processing. |
| Enriched Visitor Profile | The visitor profile was updated with new attribute values. |
| Event Processing Blocked | The event was blocked from processing. |
| Function Blocked | Consent orchestration blocked the function. |
| Imported Data Record | An imported data record was processed. |
| Log Streaming: x Actions Triggered | An action was triggered in EventStream log streaming. |
Log Streaming Action Processed (x Actions Processed / x Actions Failed) |
Shows the number of actions triggered and failed in EventStream log streaming. |
| New Visitor | A new visitor profile was created in AudienceStream. |
| Received Data Record | A data record was received for processing. |
Received (Known/Unknown) Event: event_name |
An event was received and identified by type. |
Received event with specification: event_name |
An event was received that matches a custom event specification. |
| Returning Visitor | An existing visitor profile was updated in AudienceStream. |
| Trace Has Stopped Due to Max Events | The trace stopped after reaching the maximum number of events in 12 hours. |
| Trace Started | A new trace session has started. |
| Visitor Did Not Join Or Leave Any Audience | The visitor profile update did not cause any audience changes. |
| Visitor Session Ended | The visitor session ended due to inactivity. |
| Visitor Stitched | The visitor profile was merged with another profile based on stitching rules. |
| Visit Started | A new visitor session has started. |
x Actions Processed / x Actions Failed |
Shows the number of actions triggered and failed. |
x Feed(s) Matched |
Shows the number of EventStream feeds the event matched. |
x Functions Triggered and x Functions Failed |
Shows the number of functions triggered and failed. |
This page was last updated: January 28, 2026