Visitor profile sampler
This article describes the features of the visitor profile sampler, which provides an overview of the device, badge, and audience activity from your visitors.
Use the visitor profile sampler to see an overview of the device, badge, and audience activity from your visitors to help you validate incoming visit and visitor data and gain insights into your audiences. Select a specific badge or audience to view the raw visitor profile data from a sampling of the visitors that match that item.
To use the sampler, navigate to Server-Side Tools > Visitor Profile Sampler.
How it works
The visitor profile sampler begins sampling visitor profiles based on events that happen after you enter the Visitor Profile Sampler screen. Once the screen loads, the number of sampled visitor profiles will gradually increase over time. The summary numbers update automatically to reflect the sampled data.
Visitor profile sampler requires an event from a visitor to show visitor data.
As the system samples visitor profile data, the system populates the Summary screen with the following types of visitor data:
Visitor Stitching Distribution
Displays the total number of visitor profiles sampled and how many visitors have been stitched using a known Visitor ID attribute.

Active Platforms, Active Browsers, Active Visits, Average Visit Duration, and Events per Visit
Displays the percentage of visitors using detected platforms and browsers, active visits, the average duration of a visit, and the number of events per visit.

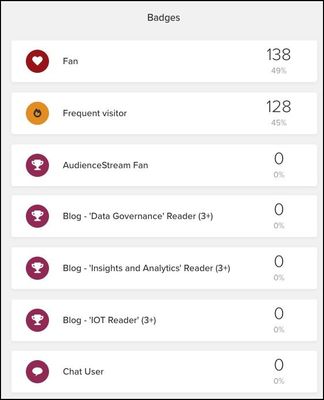
Badges
A ranked list of the number and percentage of visitors that have obtained each badge.

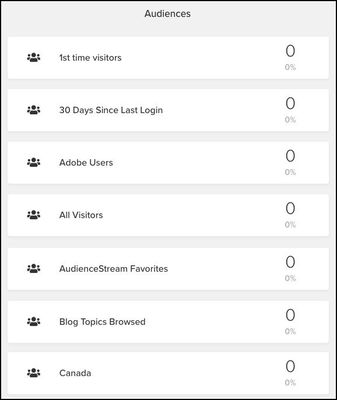
Audiences
A ranked list of the number and percentage of visitors that are in an audience.

View raw visitor data
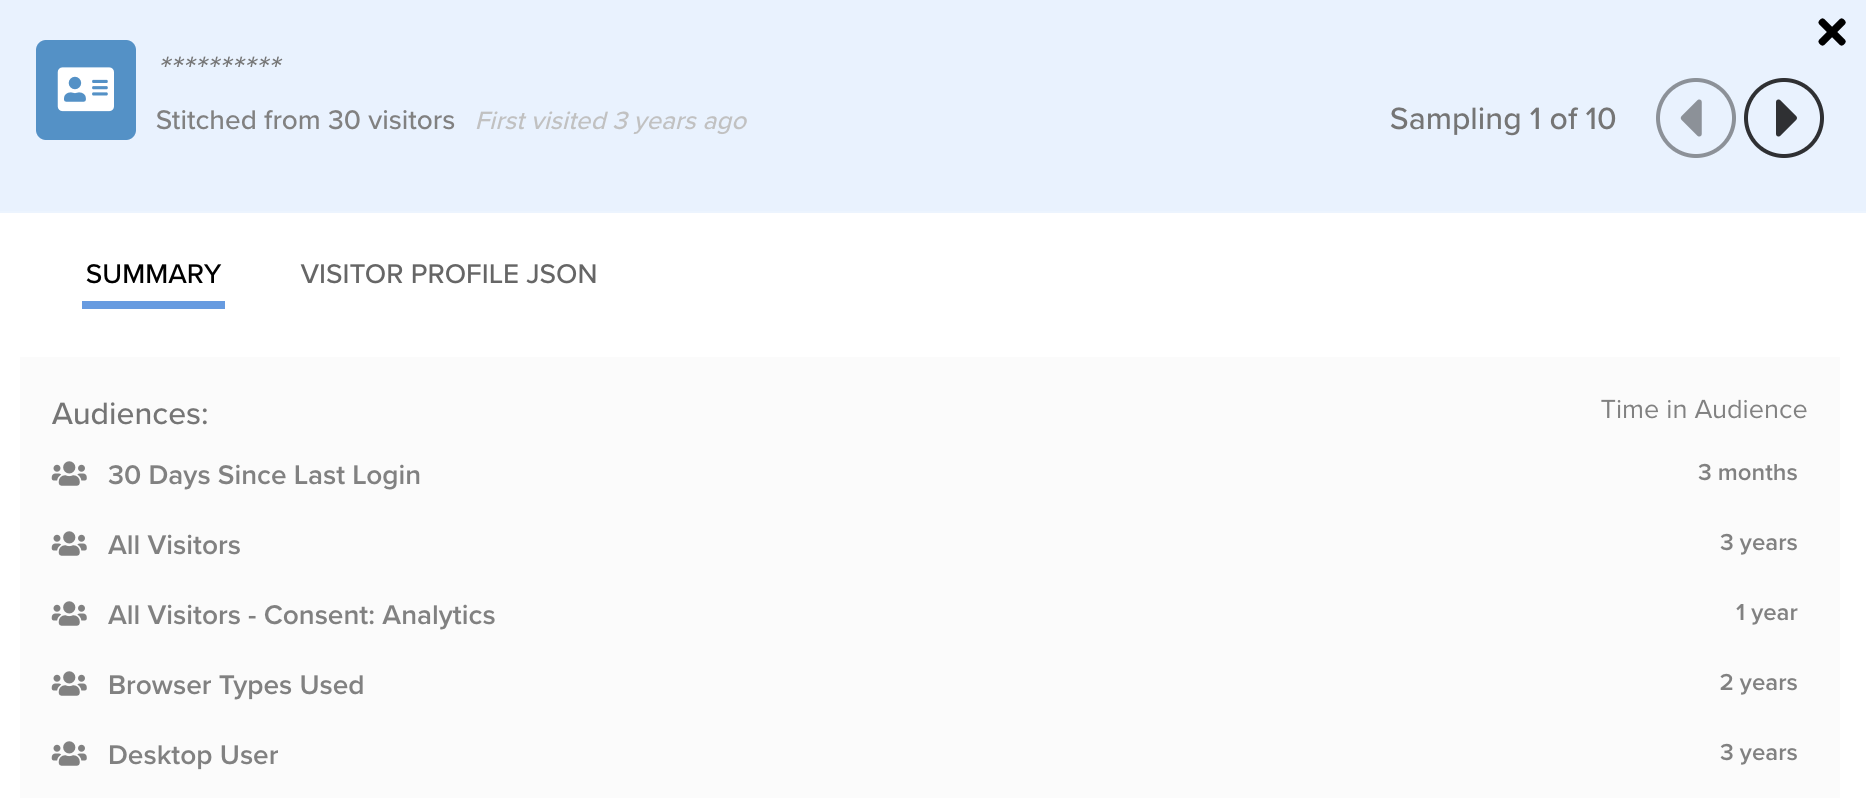
Click any bar in the visitor profile distribution chart, a badge, or an audience to view a sample data set of visitor profiles in a summary or a raw JSON view.

This page was last updated: November 2, 2023