Data Supply Chain dashboard
The Data Supply Chain dashboard provides a comprehensive summary of the data supply chain of the Customer Data Hub.
How it works
The dashboard displays three interactive panels to represent your data flow:
- Filters - adjust the dashboard view by product and by time period.
- Data Flow Summary - see summary metrics of your data flow and important status alerts.
- Data Flow Details - inspect specific components to see data connections and health status.
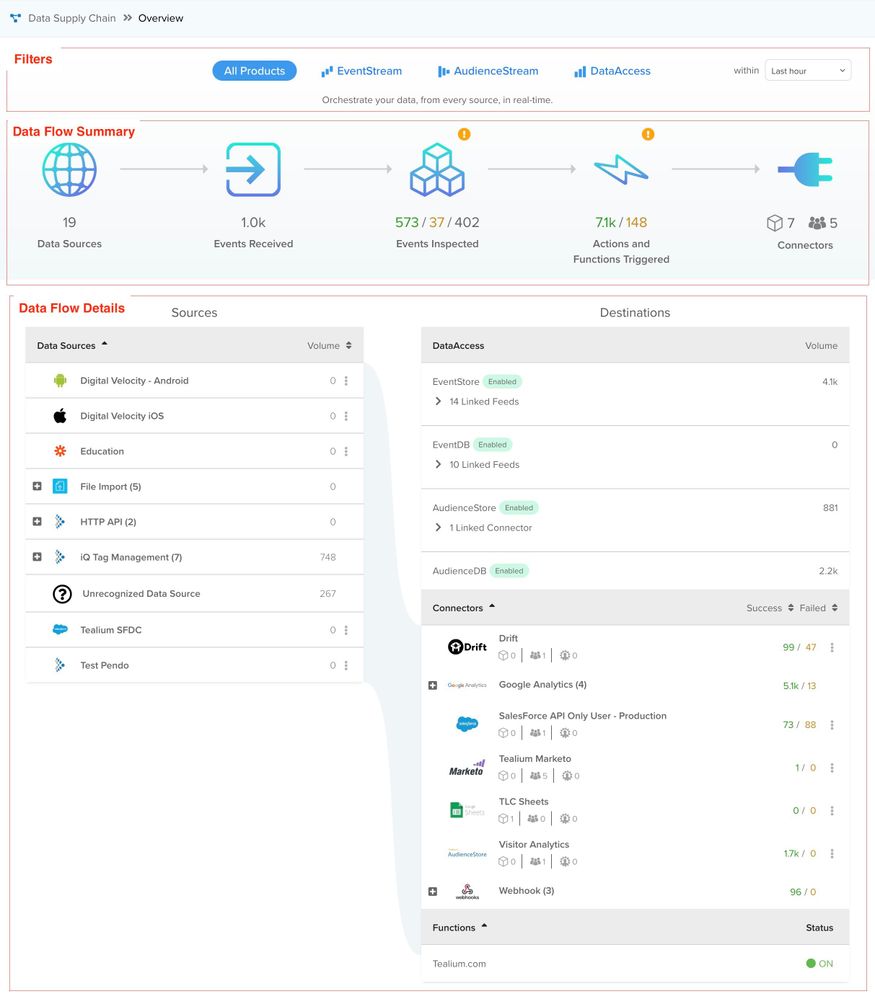
Data Supply Chain views
The Data Supply Chain dashboard view changes depending on the product view and time period selected. Select a product, and then use the drop-down list to select a time period.
Most views contain the following information, with differences described in the product-specific sections below.
- Data Sources – quick link to data sources
- Events Received – quick link to live events
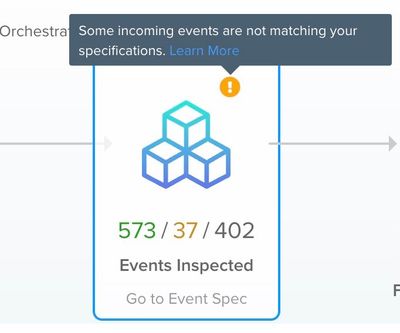
- Events Inspected – quick link to event specifications and summary metrics for event types
Heading

The heading bar appears on the top of your Tealium window. It contains the following items:
- Profile Switcher: Switch to a different account or profile.
- Search bar: Search for an attribute, rule, and action in the profile.
- Save/Publish: Save and publish your changes to the version. This button displays Read-Only Mode if you do not have Save or Publish permissions.
- Resource Center: Click this button to open a support tab. From this tab, you can file a support ticket, search our product guides, view product announcements, read marketing content and upcoming events, or submit an idea for the product.
- Concurrent Users: This icon appears if other users are logged on and using the profile. Click the icon to see which users they are and to post a message to anyone who views the profile.
- Profile Icon: Click your profile icon to display the Admin menu. The Admin menu contains all of the functions you are allowed to use on your account.
Navigation bar
The navigation bar appears on the left side of your Tealium window. It contains links to all of the available products, features, and tools. Click any item to load it in the Tealium window. If you click the client-side iQ Tag Management link, a new tab will open in your browser to load the client-side profile.
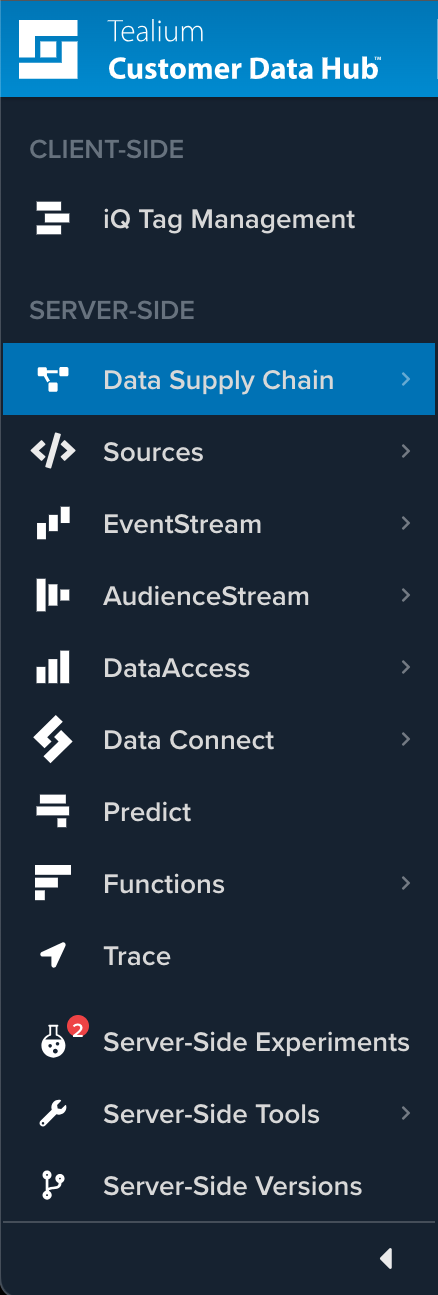
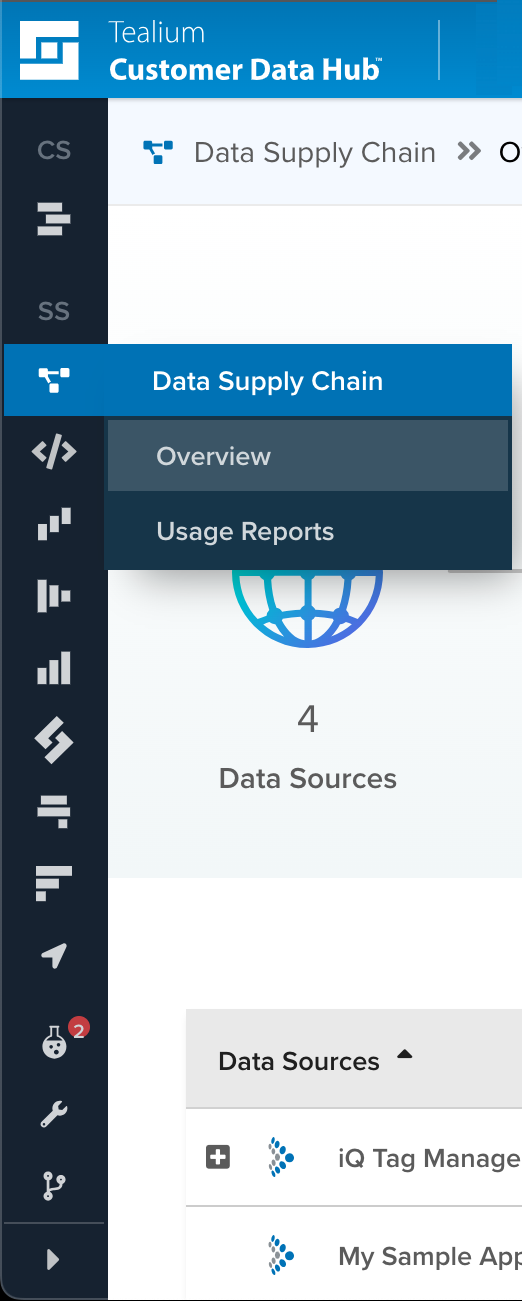
You can minimize the navigation bar by clicking the left arrow at the bottom of the navigation bar. Tealium applications appear as buttons which display the product’s functions or a tool tip describing the product it opens. To expand the navigation bar again, click the right arrow at the bottom of the navigation bar.
All Products
From the All Products summary view, select from the standard information listed in the overview or one of the following views:
- Actions Triggered – view the number of successful and failed connector actions
- Connectors – quick link to EventStream and AudienceStream connectors

EventStream
From the EventStream summary view, select from the standard information listed in the overview or one of the following views:
- Enrichments Applied – quick link to attributes
- Active Feeds – quick link to feeds
- EventStream Actions Triggered – view the number of successful or failed EventStream actions
- EventStream Connectors – quick link to EventStream connectors

AudienceStream
From the AudienceStream summary view, select from the standard information listed in the overview or one of the following views:
- Visit Count – view the number of visitors in the time period selected
- Active Audiences – quick link to audiences
- AudienceStream Actions Triggered – view the number of successful or failed AudienceStream actions
- AudienceStream Connectors – quick link to AudienceStream connectors

EventStore
From the EventStore summary view, select from the standard information listed in the overview or one of the following views:
- EventStore Feeds – quick link to feeds
- Events Sent to S3 – view the number of events sent to your S3 bucket

EventDB
From the EventDB summary view, select from the standard information listed in the overview or one of the following views:
- EventDB Feeds – quick link to feeds
- Events Sent to Redshift – view the number of events sent to Redshift

AudienceStore
From the AudienceStore summary view, select Data Sources or one of the following views:
- Active Audiences – quick link to audiences
- Visitors Sent to S3 – view the number of visitors sent to your S3 bucket

AudienceDB
From the AudienceDB summary view, select Data Sources or one of the following views:
- Active Audiences – quick link to audiences
- Visitors Sent to RedShift – view the number of visitors sent to Redshift

Additional views and navigation
This section describes additional views and the interactions available within with the body of the interface.
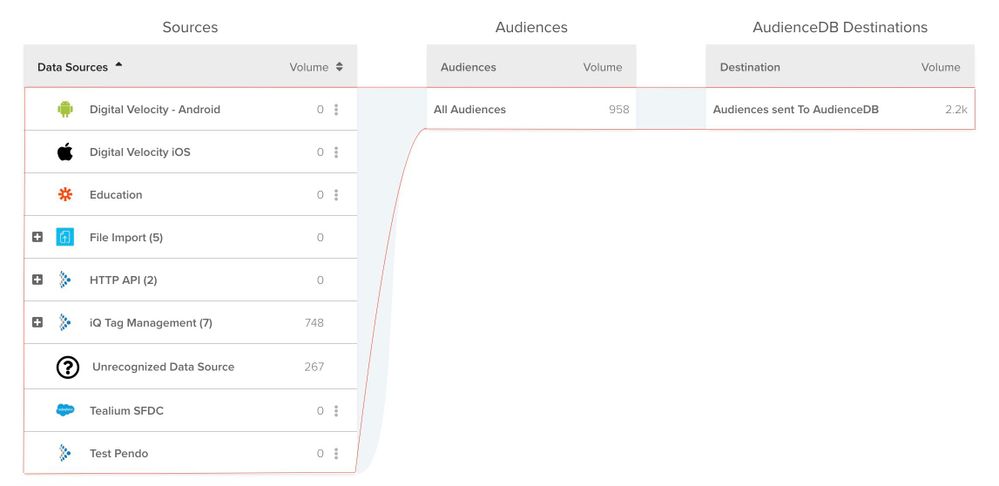
View data flow and relationships
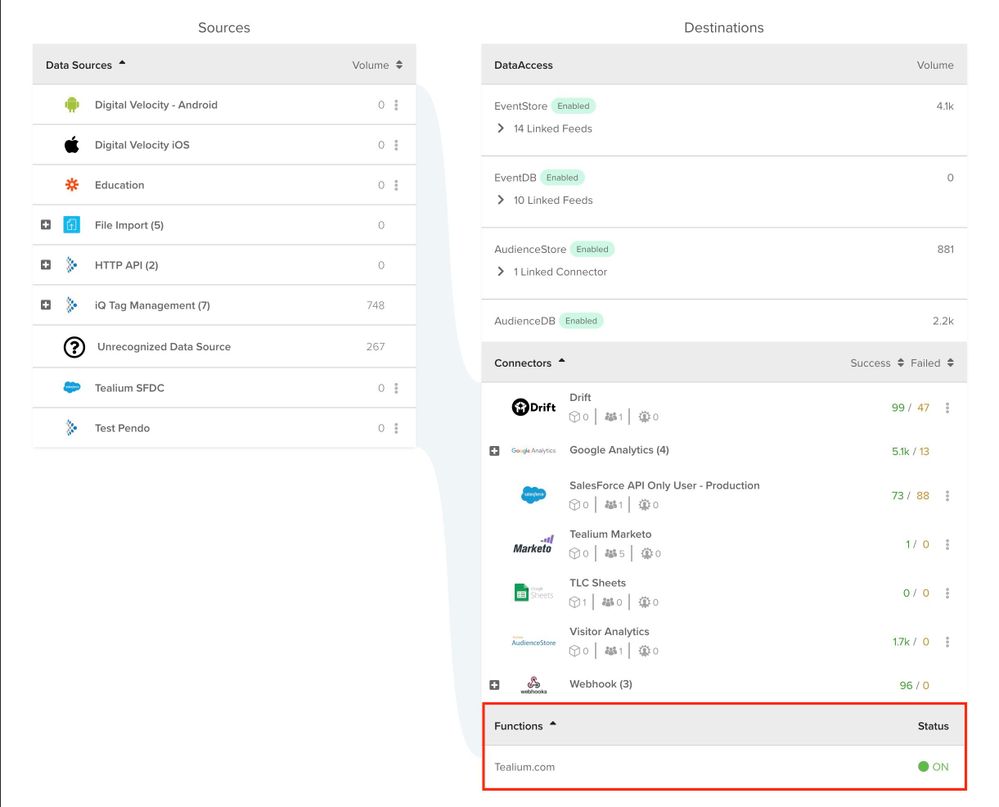
Data relationships and data flow are clearly shown in the lower portion of your screen. You can quickly view these relationships and the flow and drill down into the details of related items to edit.
Functions
The All Products view displays a list of created functions and their status at the bottom of your screen.
Expand and collapse
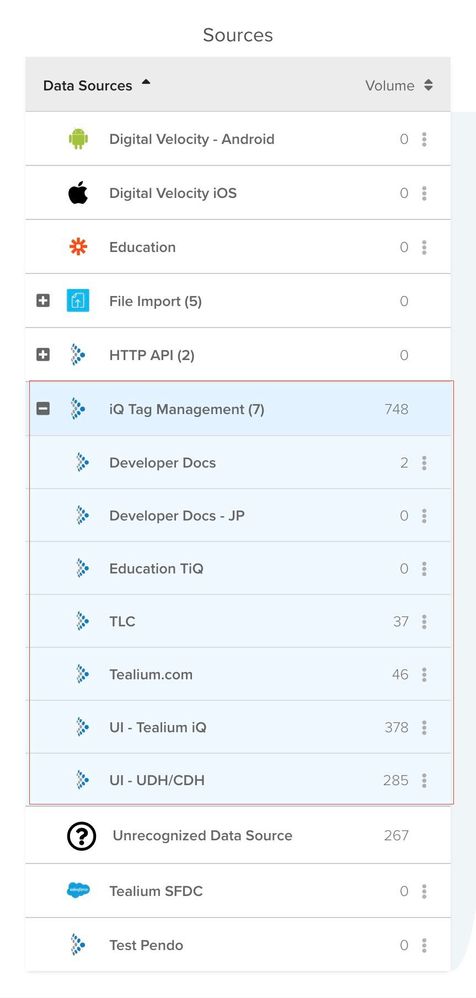
Expand or collapse the details for an item.
Sort results
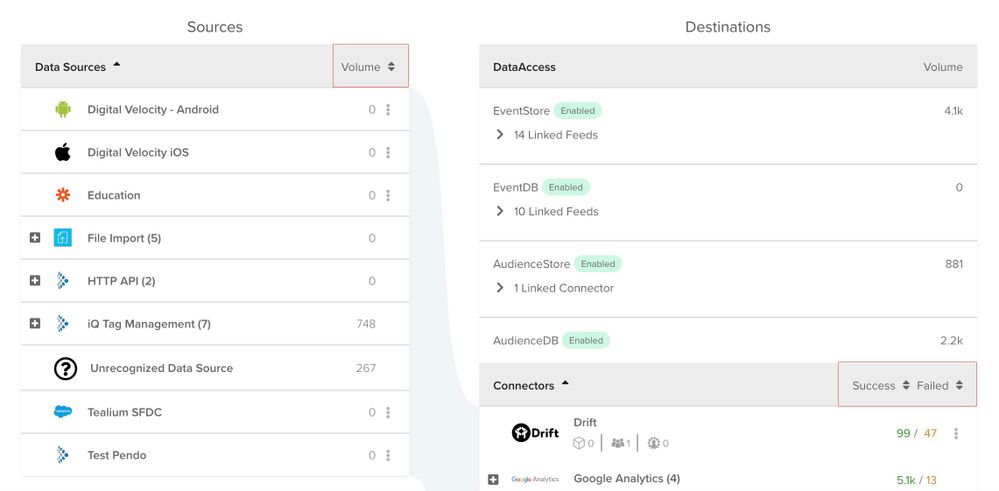
Use the up (▲) or down (▼) arrows to sort results by volume, action success, or action failure.
More options
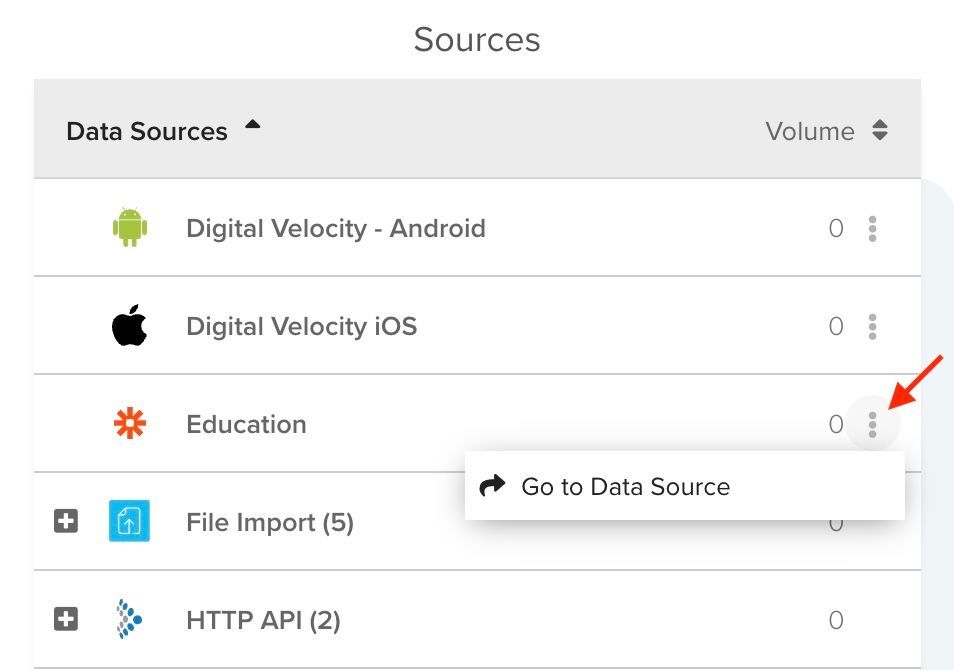
Click the more options action button (︙) to go directly to a data source, connector, or event feed to edit.
View errors and warnings
Hold the pointer over the warning icon to view error or warning messages, and click the Learn More link to read about how to solve the issue.
This page was last updated: December 2, 2024